Full Report
Figures converted from ILS to USD at historical FX rates (frankfurter.app). Monetary statements are shown in US$ millions; per-share figures use the matching period rate. Filing links open the native figures from which each USD value was derived.
The numbers behind NICE Ltd.: as-reported financial statements and company metrics for FY2021–FY2025, traced to the source filings, opened with the share-price history those statements have to justify. Every linked USD figure opens the exact filing row containing the native reported value from which it was converted. Amounts in US$ millions unless noted.
Reading notes: All annual figures are from the audited consolidated financial statements in NICE Ltd.'s Form 20-F filings, in U.S. dollars in thousands exactly as printed. Each fiscal year FY2021-FY2025 is cited to its own 20-F (the leftmost/current-year column). Revenue is disaggregated two ways: the hero breakdown is by reportable segment (Customer Engagement and Financial Crime and Compliance, from Note 16), and the income statement shows the revenue-type split (Cloud / Services / Product) printed on the face of the statement. FY2019 and FY2020 long-term-record figures are comparative columns of the FY2021 Form 20-F and are cited to it. Balance-sheet 'Total shareholders' equity' is the filing total including non-controlling interests; the standardized data feed reports equity attributable to NICE shareholders (excludes NCI). See discrepancies.
Share Price — Available History Since January 2026
The stock closed at $95.25 on Jul 21, 2026 — down 13% over the window shown, trading between $80.36 and $129.88. At that close the stock trades at 31× FY2025 diluted EPS as reported below.
Source: market price feed, daily closes, Jan 2026–Jul 2026 — the feed marks this available history as partial. Price return only, excludes dividends. Prices converted from ILS to USD with date-matched or nearest-available FX.
Market capitalization $6.3bn.
Market cap = 66.5M shares outstanding × the Jul 21, 2026 close of $95.25. Market-derived, shown without filing links.
FY2025 at a Glance
Revenue (US$ millions)
Operating income (US$ millions)
Net income (US$ millions)
Diluted EPS
Source: FY2025 consolidated statements [1] [2] [3] [4]. Click any linked figure to open the filing page with the row highlighted.
Revenue by Reportable Segment
| Revenue by Reportable Segment | FY2021 | FY2022 | FY2023 | FY2024 | FY2025 |
|---|---|---|---|---|---|
| Customer Engagement | 506 | 502 | 545 | 626 | 771 |
| Financial Crime and Compliance | 112 | 117 | 111 | 124 | 152 |
| Total revenue | 619 | 620 | 657 | 750 | 924 |
| Total revenue growth, derived | — | +0.1% | +6.0% | +14.2% | +23.1% |
Source: Note 16 - Reportable Segments and Geographical Information [5] [6] [7] [8]. Click any linked figure to open the filing page with the row highlighted.
Operating Income by Reportable Segment
| Operating Income by Reportable Segment | FY2021 | FY2022 | FY2023 | FY2024 | FY2025 |
|---|---|---|---|---|---|
| Customer Engagement | 102 | 98 | 126 | 157 | 209 |
| Financial Crime and Compliance | 34 | 45 | 36 | 43 | 52 |
| Corporate and unallocated | (51) | (48) | (42) | (51) | (58) |
| Total operating income | 85 | 95 | 120 | 150 | 202 |
Source: Note 16 - Reportable Segments (segment operating income) [5] [6] [7] [8]. Click any linked figure to open the filing page with the row highlighted.
Income Statement
Source: Consolidated Statements of Income [1] [2] [3] [4]. Click any linked figure to open the filing page with the row highlighted.
Columns marked E are consensus analyst estimates from S&P Capital IQ (CapIQ), shown alongside reported results for direct comparison; they are not company guidance.
Estimate source: S&P Capital IQ (CapIQ) consensus, as of 2026-07-23. Estimate figures are S&P Capital IQ consensus (vendor data — no filing page links). EPS and net income use the normalized (adjusted) consensus where the street reports it. Line-item analyst models (segments, drivers, KPIs) are in the Visible Alpha tab.
Balance Sheet
Source: Consolidated Balance Sheets [9] [10] [11] [12]. Click any linked figure to open the filing page with the row highlighted.
Cash Flow
Source: Consolidated Statements of Cash Flows [13] [14] [15] [16]. Click any linked figure to open the filing page with the row highlighted.
Cloud Transition Recurring Revenue
| Cloud Transition Recurring Revenue | FY2021 | FY2022 | FY2023 | FY2024 | FY2025 |
|---|---|---|---|---|---|
| Cloud revenue as % of total revenue | 53.0% | 59.4% | 66.5% | 72.5% | 76.0% |
| Cloud revenue growth (YoY) | 31.0% | 27.2% | 22.1% | 25.4% | 12.8% |
| Cloud gross margin (% of cloud revenue) | — | — | 65.0% | 64.7% | 65.6% |
| Remaining performance obligations (backlog) | 571 | 645 | 703 | 843 | 1,152 |
Source: company filings [17] [18] [19] [20]. Click any linked figure to open the filing page with the row highlighted.
Revenue by Geography
| Revenue by Geography | FY2021 | FY2022 | FY2023 | FY2024 | FY2025 |
|---|---|---|---|---|---|
| Americas (principally the US) | 505 | 512 | 549 | 637 | 773 |
| EMEA | 76 | 70 | 68 | 75 | 101 |
| Israel | 1 | 1 | 1 | 1 | 1 |
| Asia Pacific | 37 | 37 | 39 | 37 | 49 |
Source: company filings [21] [22]. Click any linked figure to open the filing page with the row highlighted.
Workforce (Full-Time Employees)
| Workforce (Full-Time Employees) | FY2021 | FY2022 | FY2023 | FY2024 | FY2025 |
|---|---|---|---|---|---|
| Total employees | 7,102 | 7,926 | 8,384 | 8,726 | 9,626 |
| Research and Development | 2,303 | 2,643 | 2,780 | 3,070 | 3,521 |
| Sales and Marketing | 1,471 | 1,678 | 1,746 | 1,808 | 1,948 |
| Customer Support | 2,603 | 2,794 | 3,012 | 2,994 | 3,207 |
| General and Administrative | 725 | 811 | 846 | 854 | 950 |
Source: company filings [23] [24]. Click any linked figure to open the filing page with the row highlighted.
Long-Term Record
| Fiscal year | Total revenue | Operating income | Net income | Diluted earnings per share | Net cash provided by operating activities |
|---|---|---|---|---|---|
| FY2019 | 507 | 77 | 60 | 0.93 | 121 |
| FY2020 | 531 | 78 | 63 | 0.96 | 155 |
| FY2021 | 619 | 85 | 64 | 0.96 | 149 |
| FY2022 | 620 | 95 | 76 | 1.14 | 136 |
| FY2023 | 657 | 120 | 93 | 1.41 | 155 |
| FY2024 | 750 | 150 | 121 | 1.85 | 228 |
| FY2025 | 924 | 202 | 192 | 3.03 | 225 |
Source: consolidated statements across filings; older years from the standardized feed [14] [1] [16] [2]. Click any linked figure to open the filing page with the row highlighted.
Analyst Consensus
Mean target
Median target
High target
Low target
Street ratings: 1 strong buy. Consensus: Strong Buy.
Estimate source: S&P Capital IQ (CapIQ) consensus, as of 2026-07-23. Estimate figures are S&P Capital IQ consensus (vendor data — no filing page links). EPS and net income use the normalized (adjusted) consensus where the street reports it. Line-item analyst models (segments, drivers, KPIs) are in the Visible Alpha tab.
Traceability
392 of 392 figures on this page (100%) link to the filing page containing the native reported figure from which the USD value was converted — click a linked figure to open that source row. Unlinked figures come from standardized data feeds or pre-filing years.
All annual figures are from the audited consolidated financial statements in NICE Ltd.'s Form 20-F filings, in U.S. dollars in thousands exactly as printed. Each fiscal year FY2021-FY2025 is cited to its own 20-F (the leftmost/current-year column).
Revenue is disaggregated two ways: the hero breakdown is by reportable segment (Customer Engagement and Financial Crime and Compliance, from Note 16), and the income statement shows the revenue-type split (Cloud / Services / Product) printed on the face of the statement.
FY2019 and FY2020 long-term-record figures are comparative columns of the FY2021 Form 20-F and are cited to it.
Balance-sheet 'Total shareholders' equity' is the filing total including non-controlling interests; the standardized data feed reports equity attributable to NICE shareholders (excludes NCI). See discrepancies.
Cash-flow capital expenditure is split by the filing into 'Purchase of property and equipment' and 'Capitalization of internal use software costs'; the two together equal the standardized feed's single capex figure.
Quarterly figures are from NICE's quarterly earnings press releases (Form 6-K exhibits). Each release prints a single-quarter income statement, a point-in-time balance sheet, and a single-quarter (three-months-ended) cash-flow statement, so no derivation is required. NICE's fiscal year equals the calendar year (e.g. Q1 FY26 = quarter ended March 31, 2026).
2 figure(s) differed between the data feed and the filing; the filing value is shown (see the run's metrics/metrics_tab.json for the audit trail).
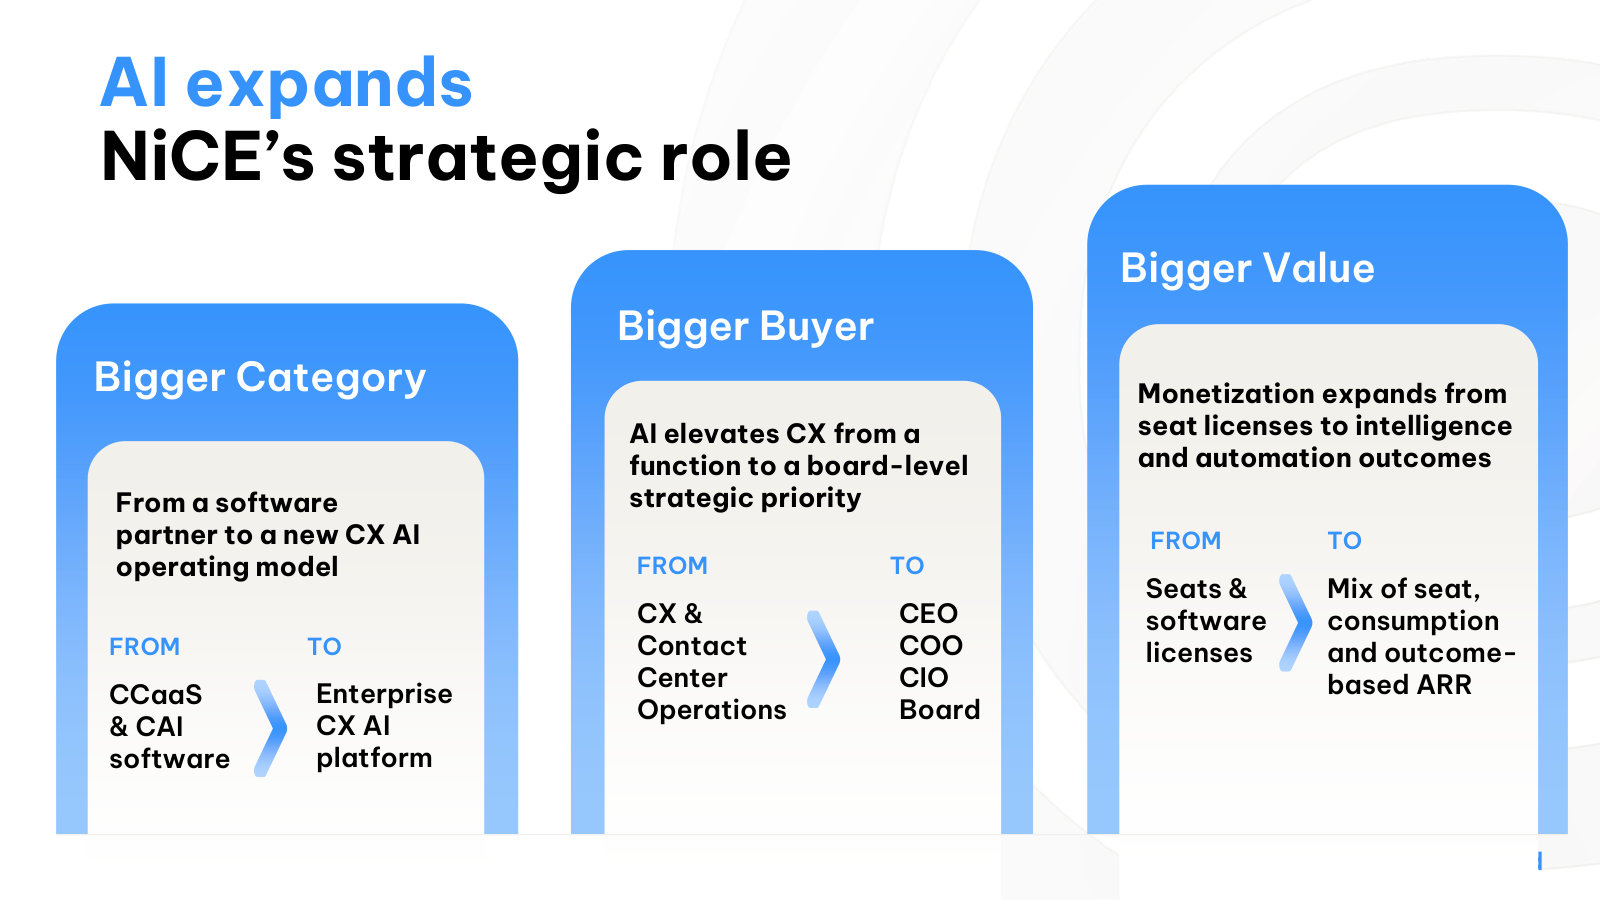
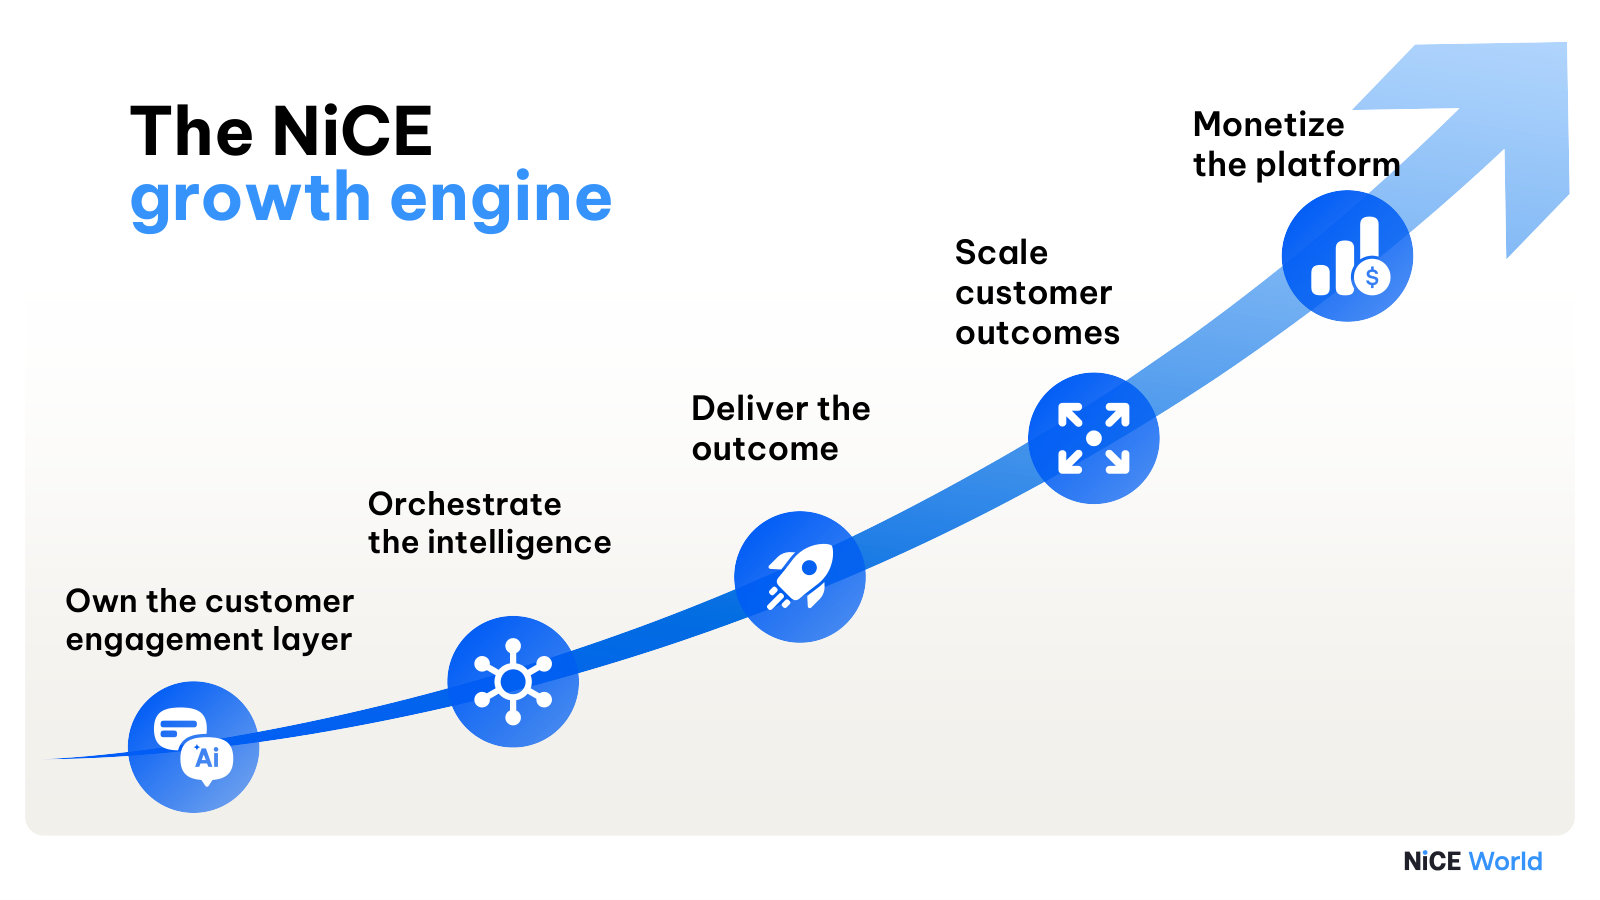
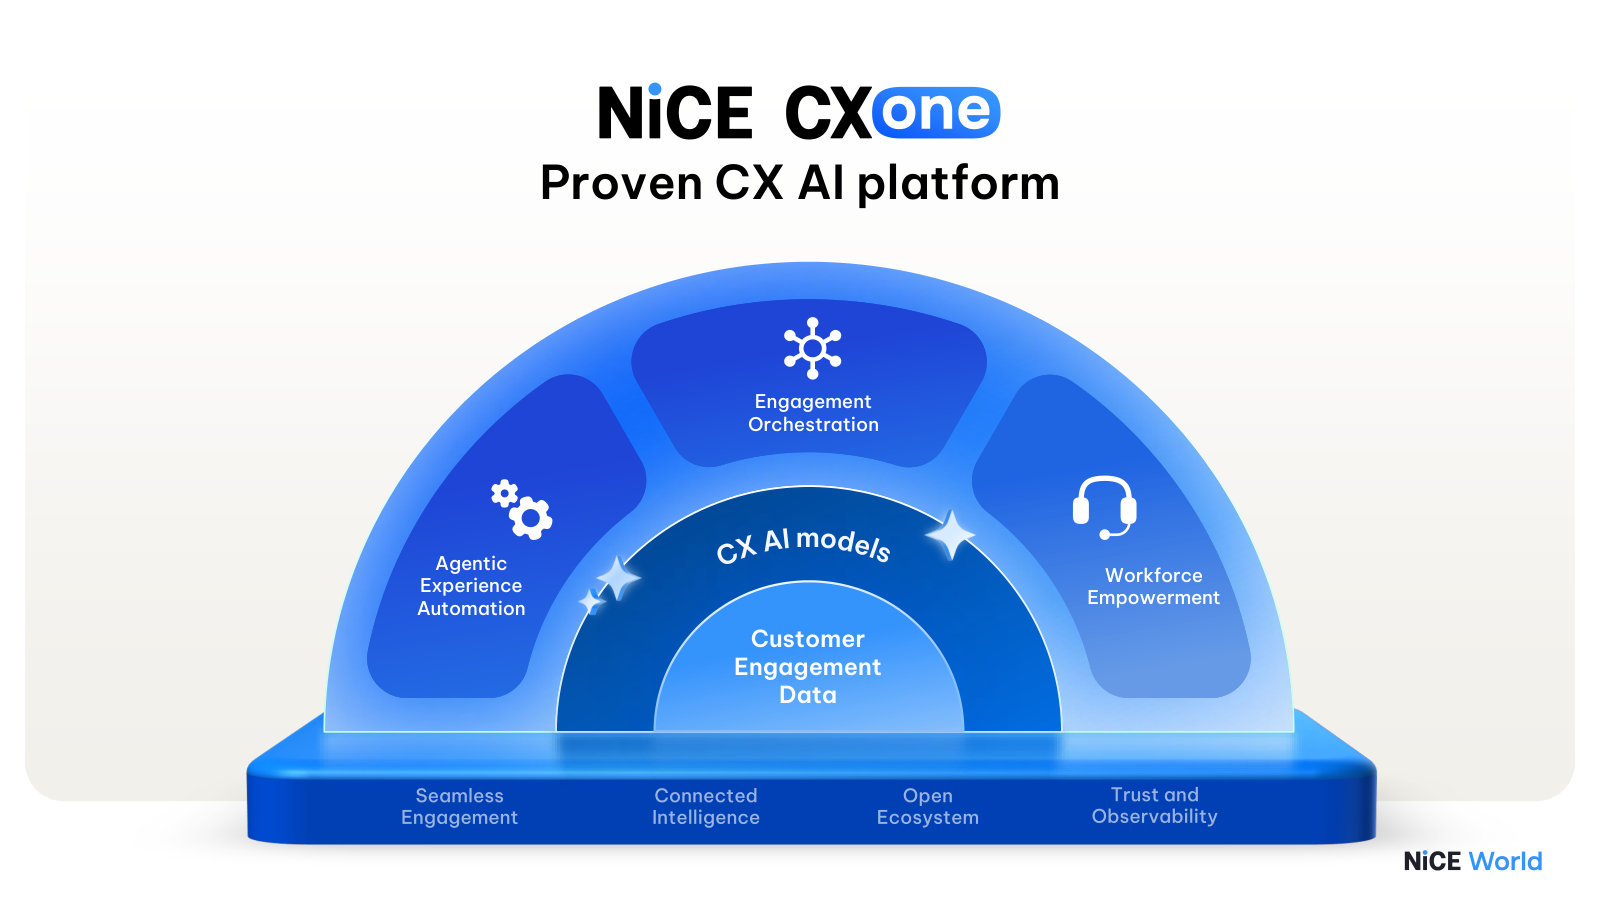
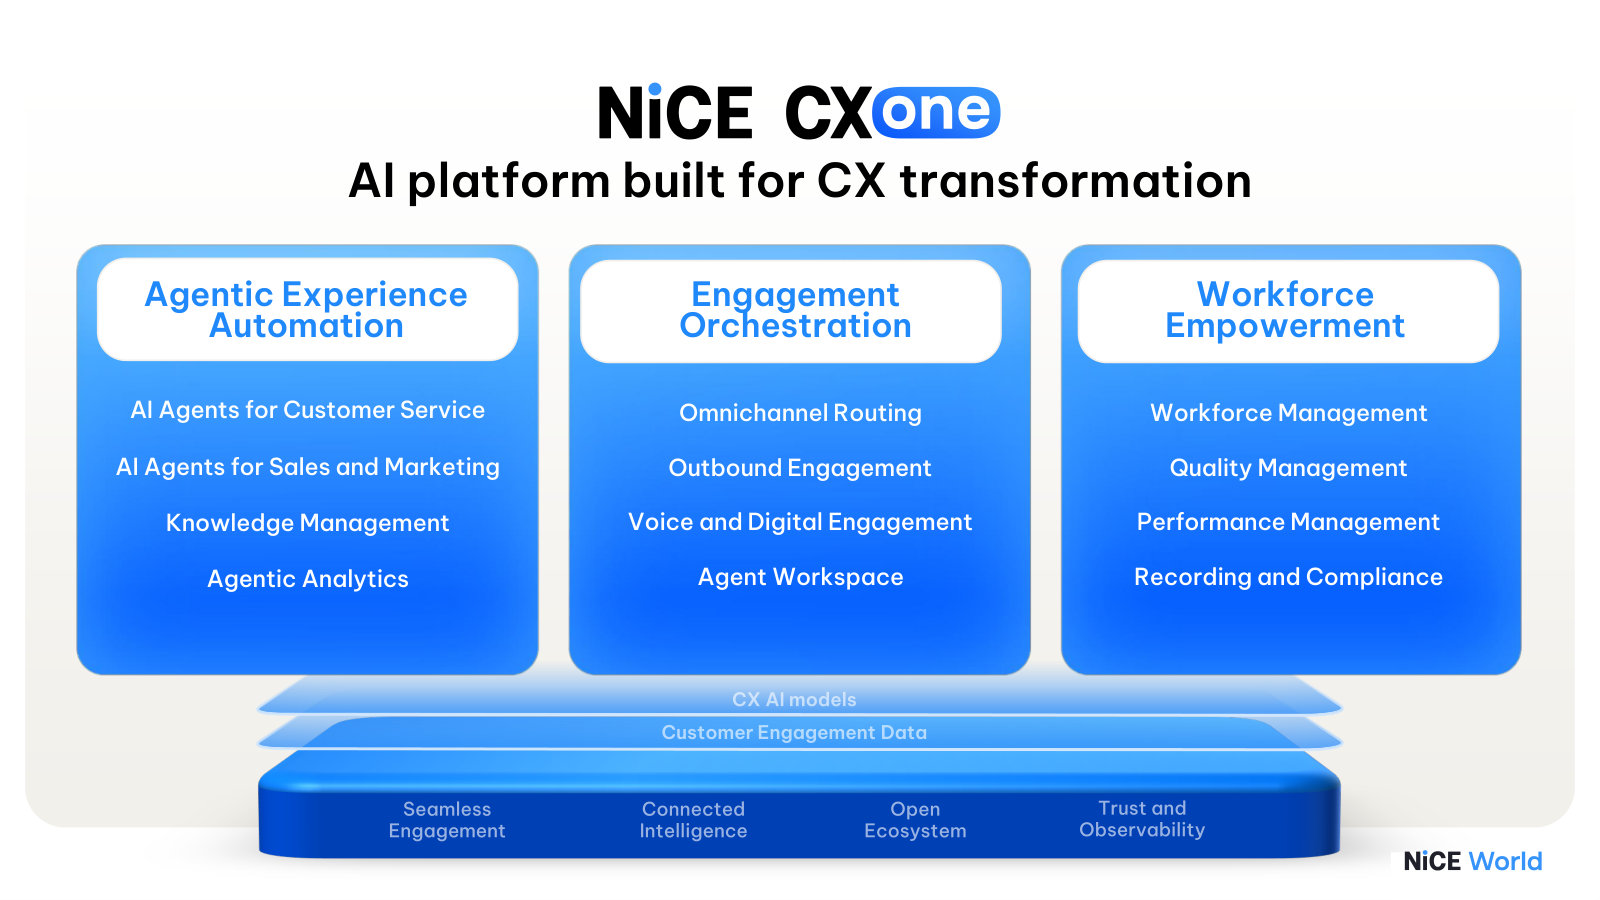
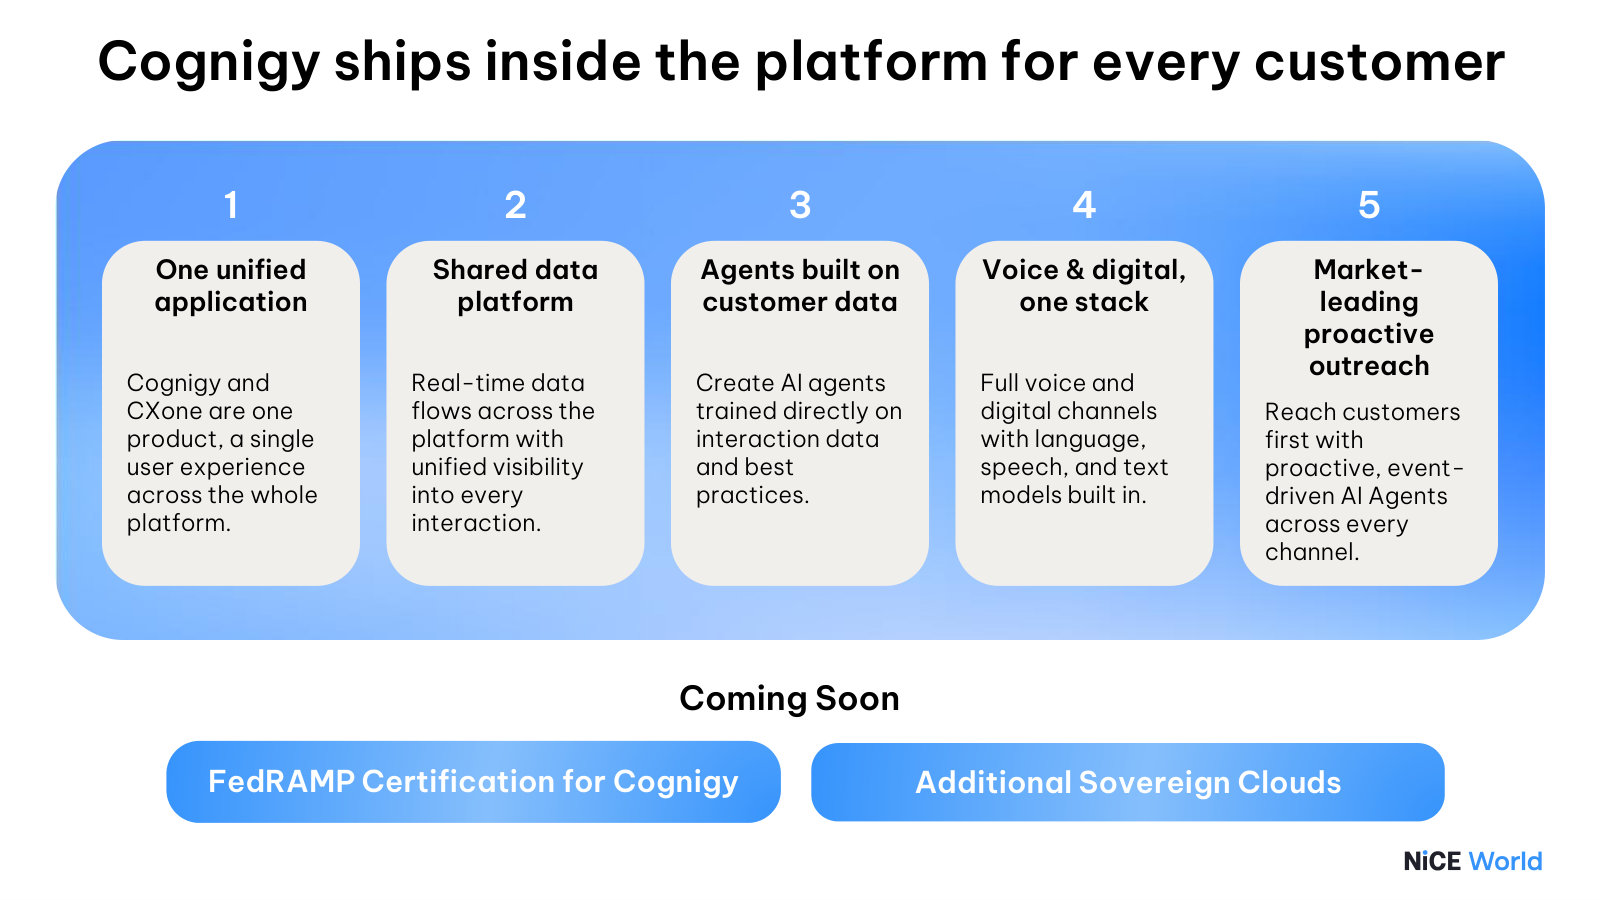
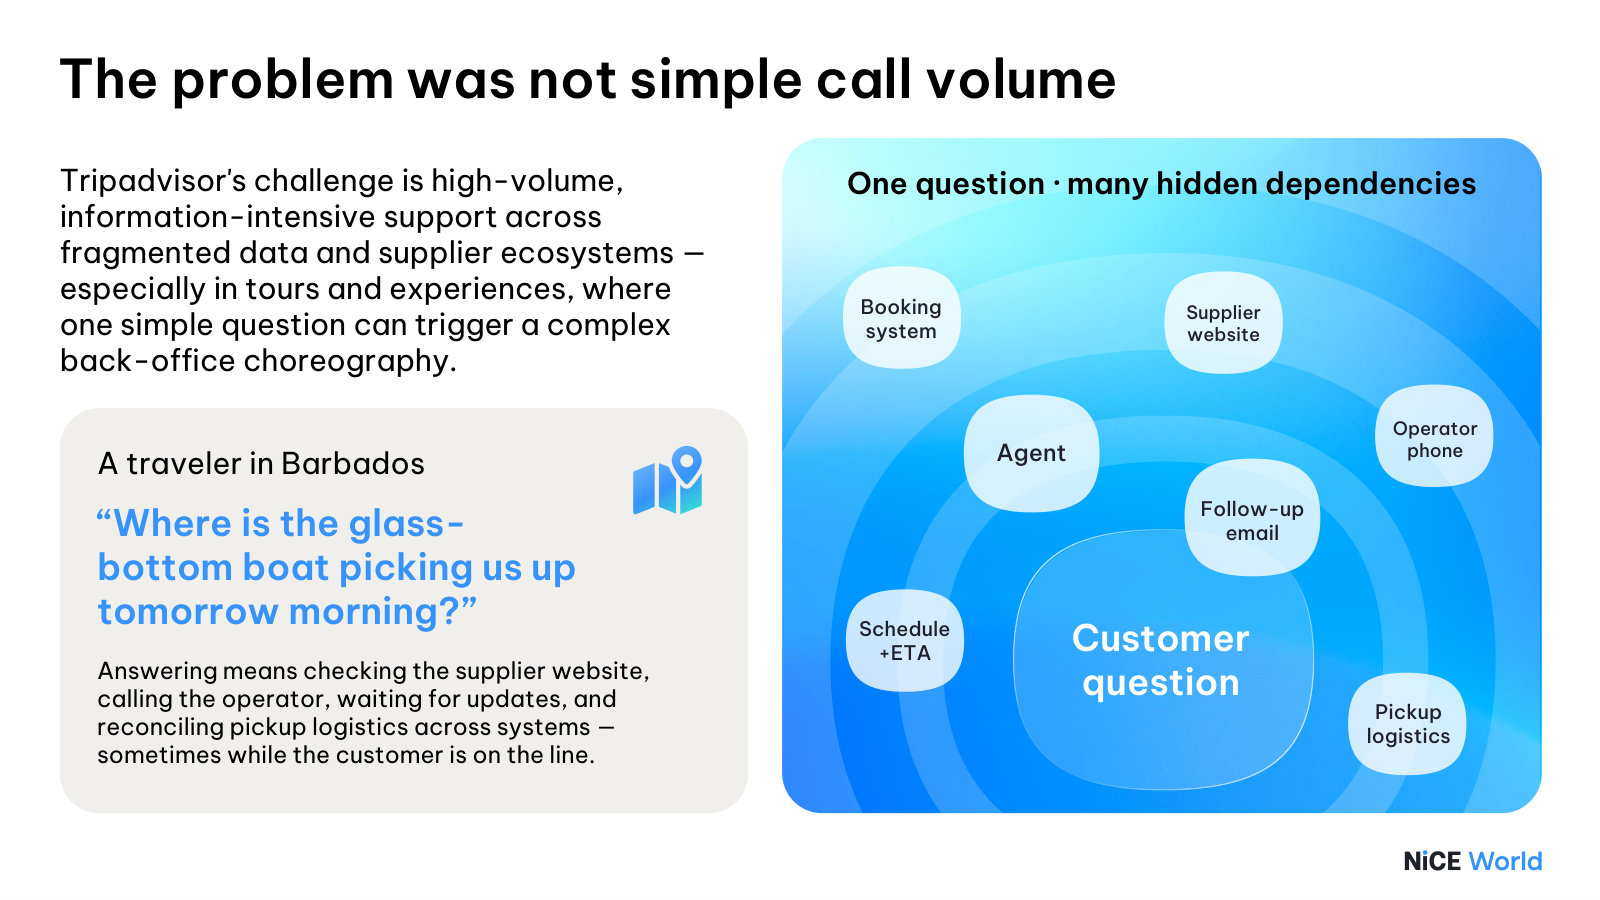
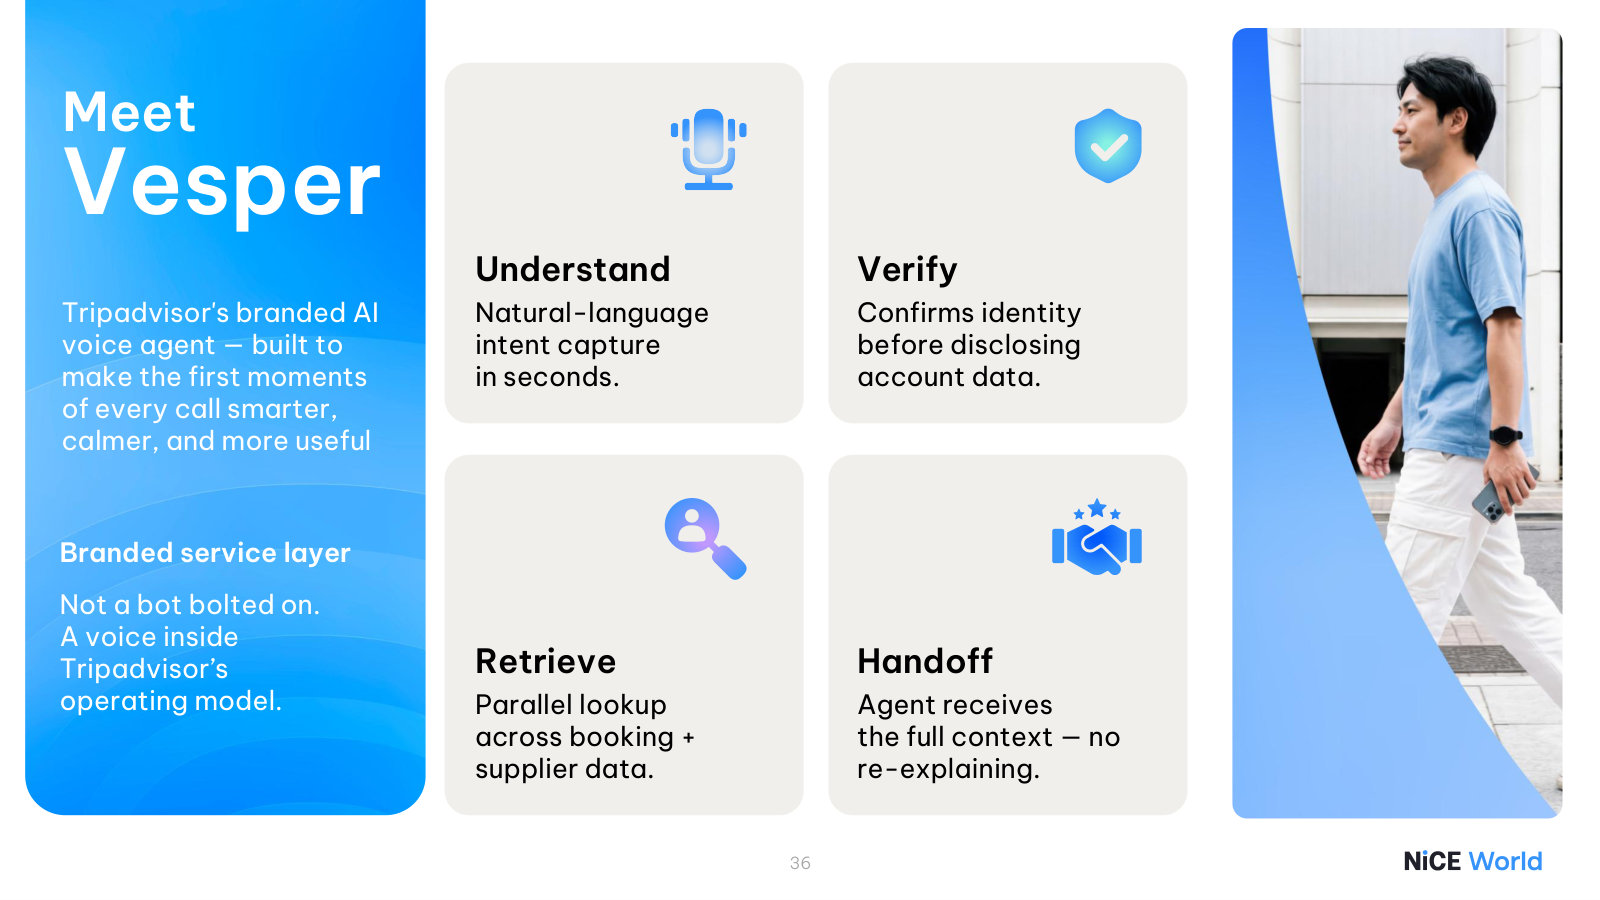
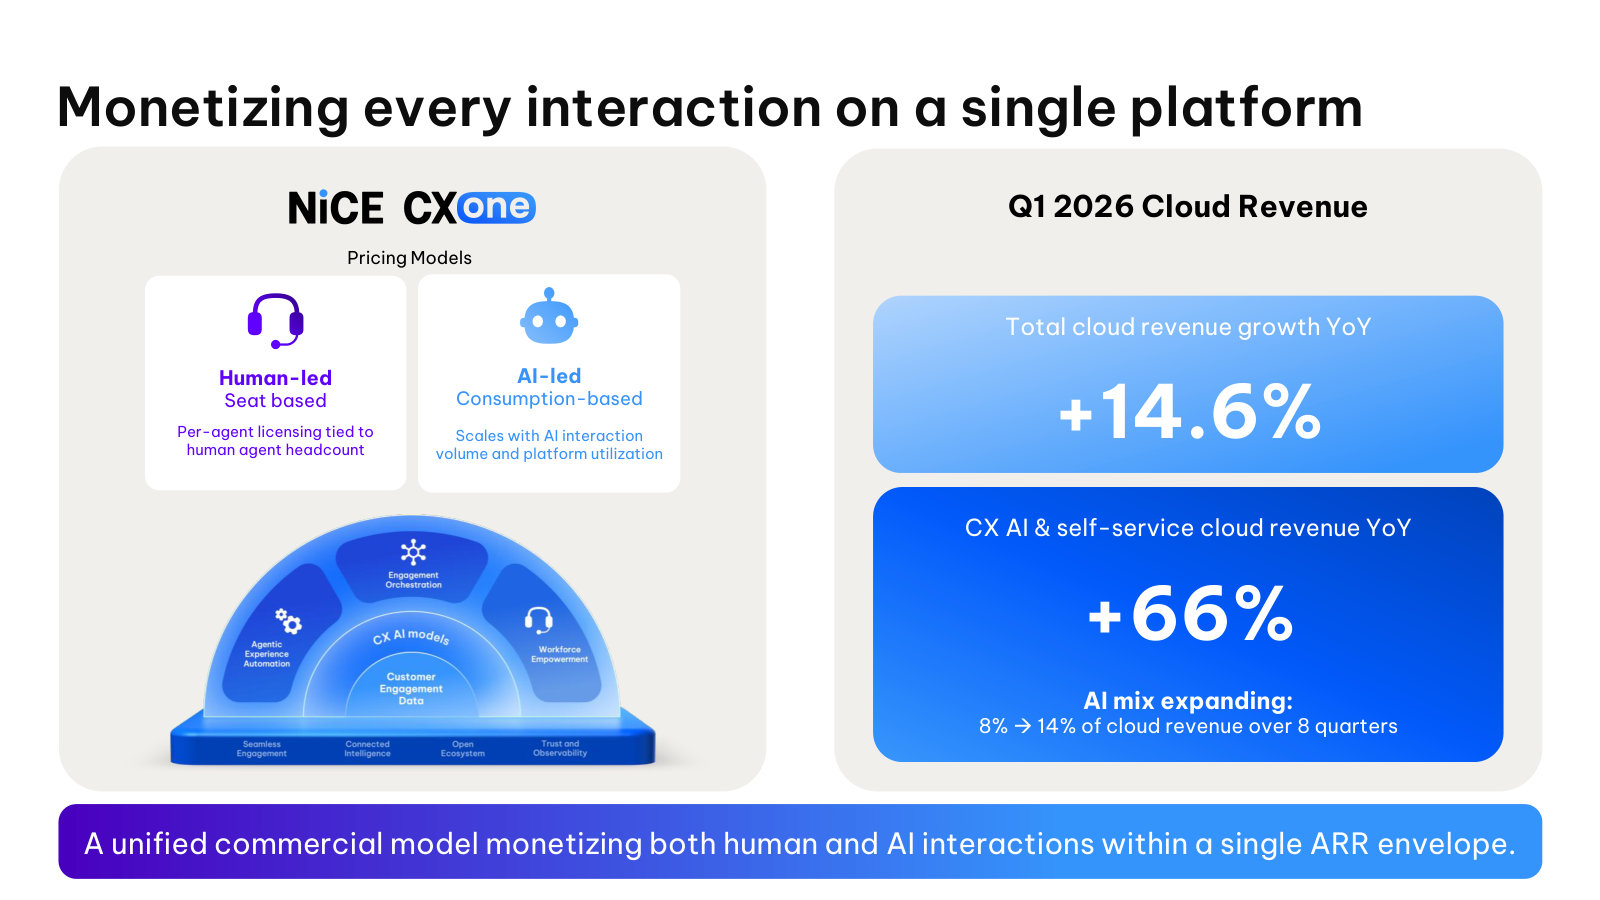
NICE Ltd.'s management explains the business in its own materials. The slides below do the most of that work, pulled from the documents preserved in Sources. Each source link opens the complete presentation at that slide in a new tab.
Investor & Analyst Day 2026 — 2026
Management's fullest current statement of the CX-AI strategy — platform, competitive position, the Cognigy integration and unit economics. · Open the full document →
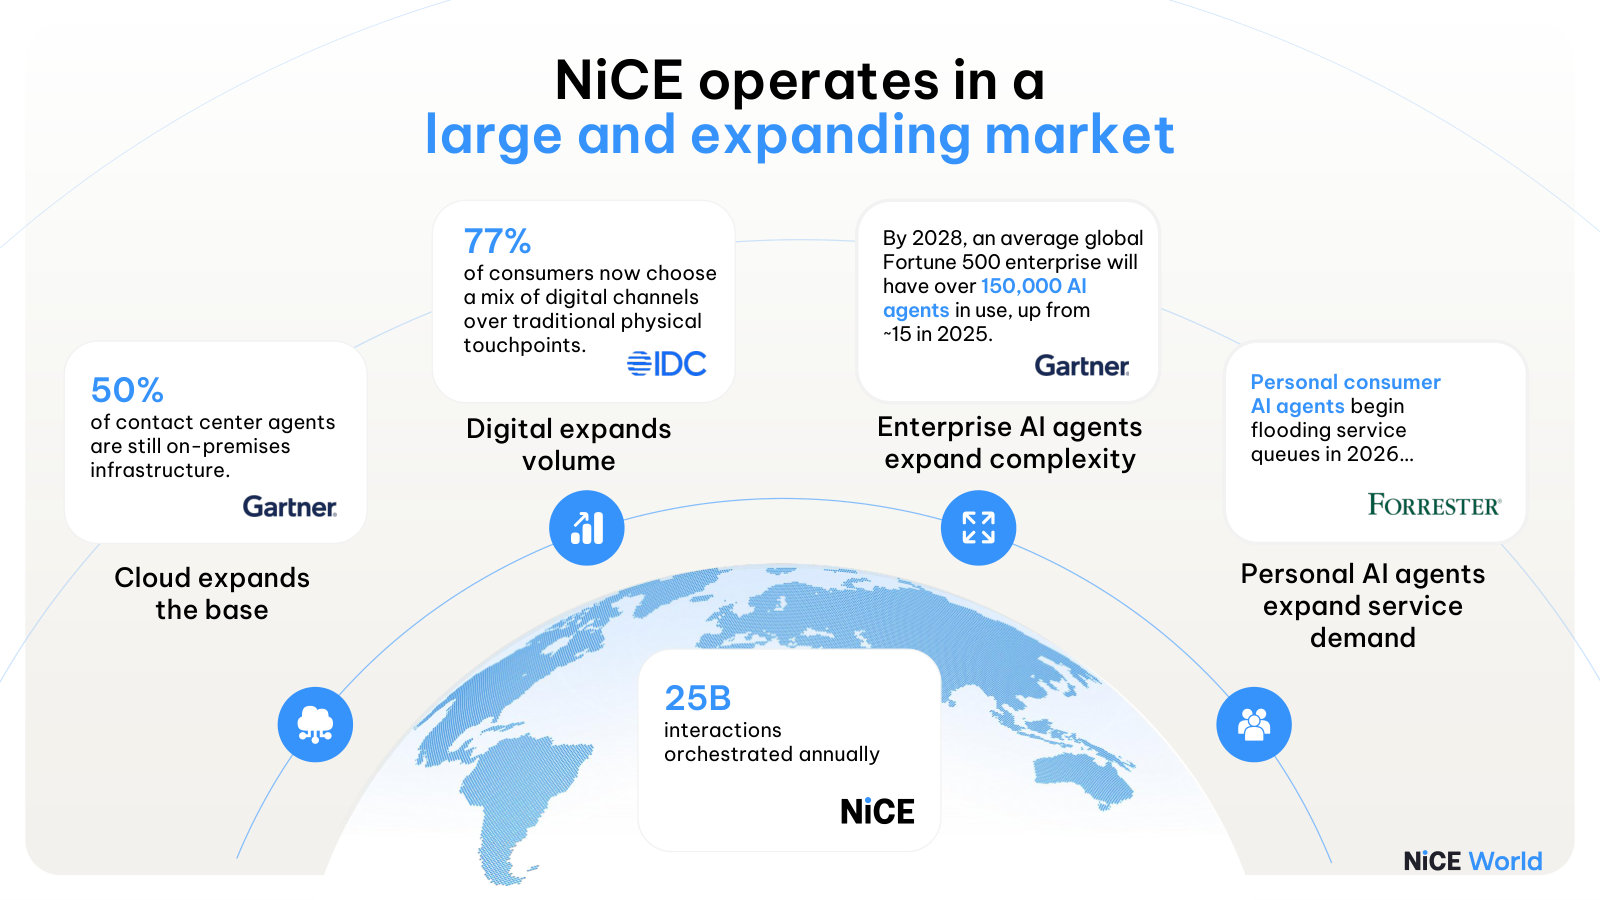
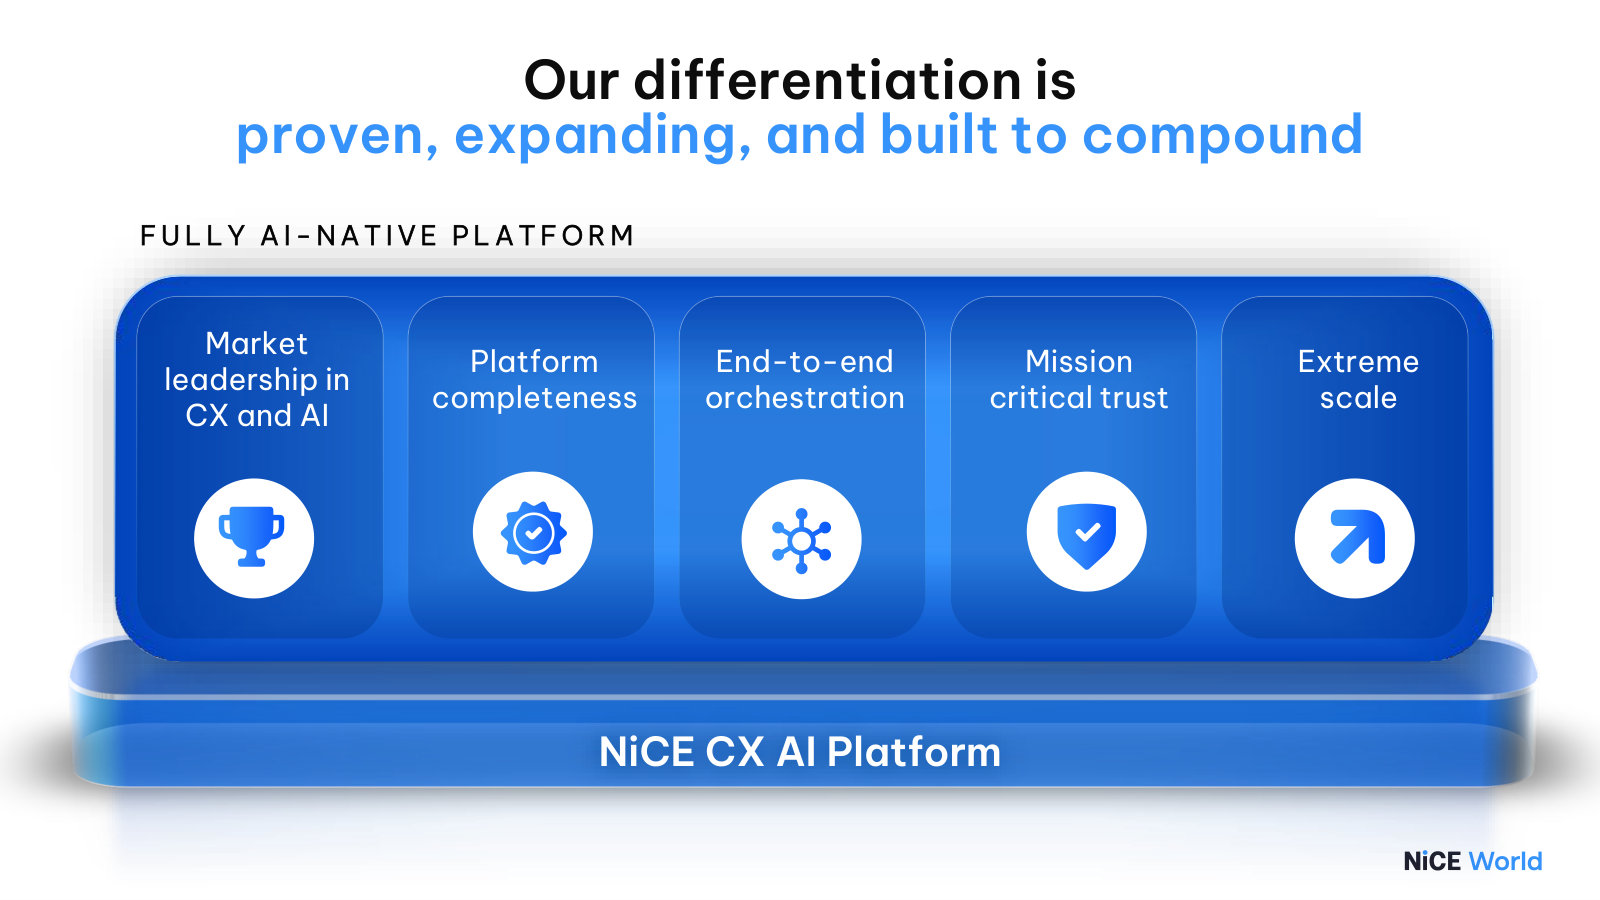
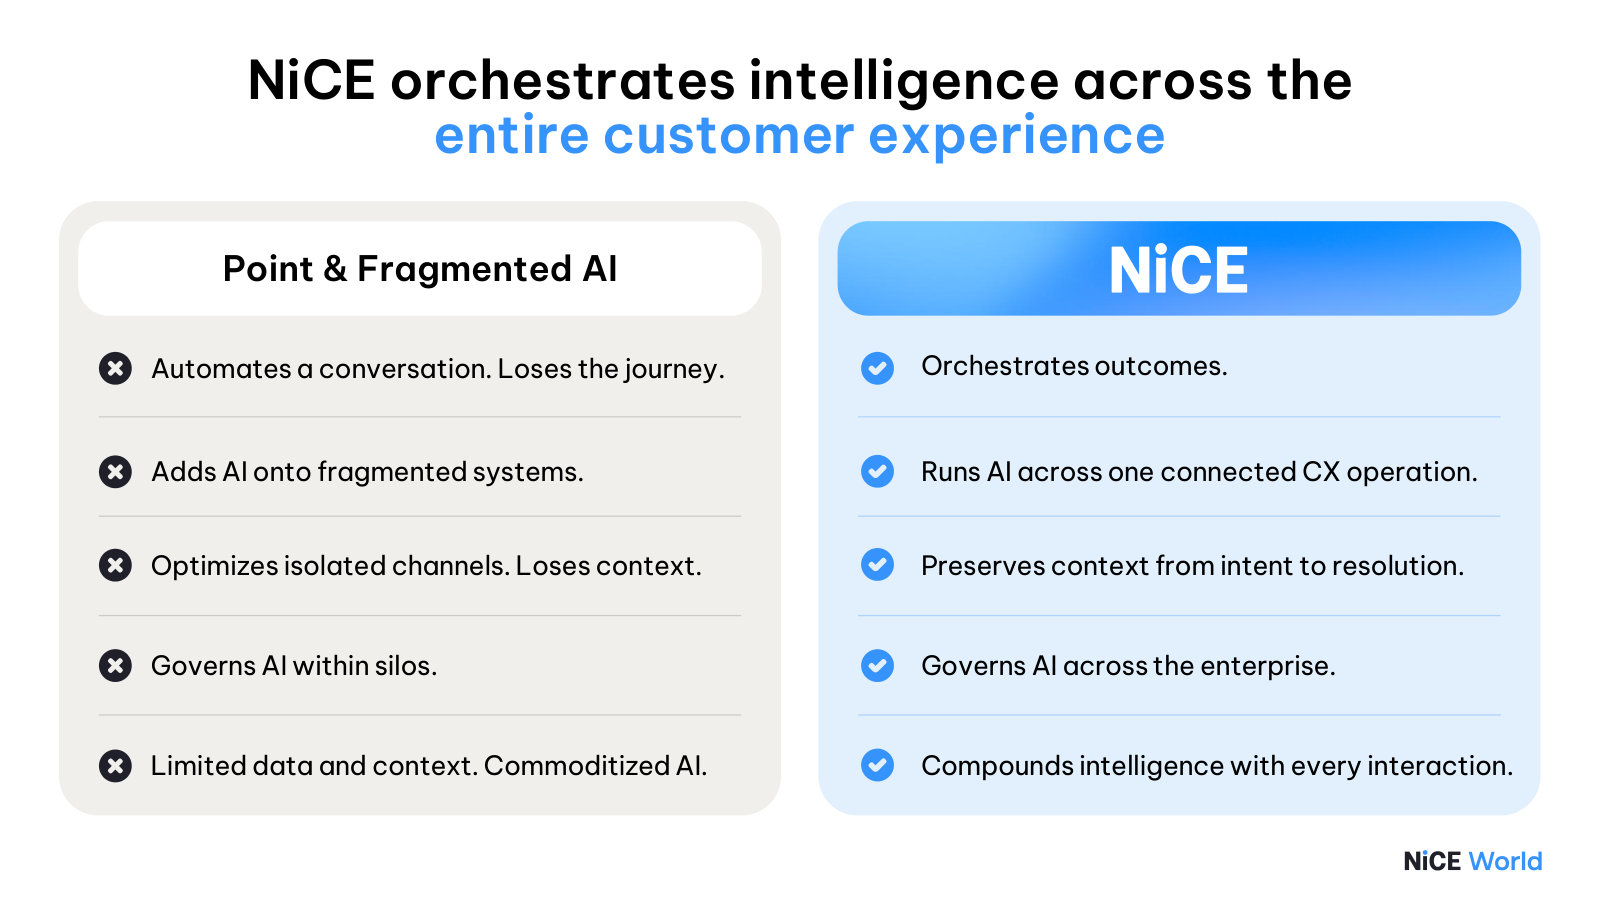
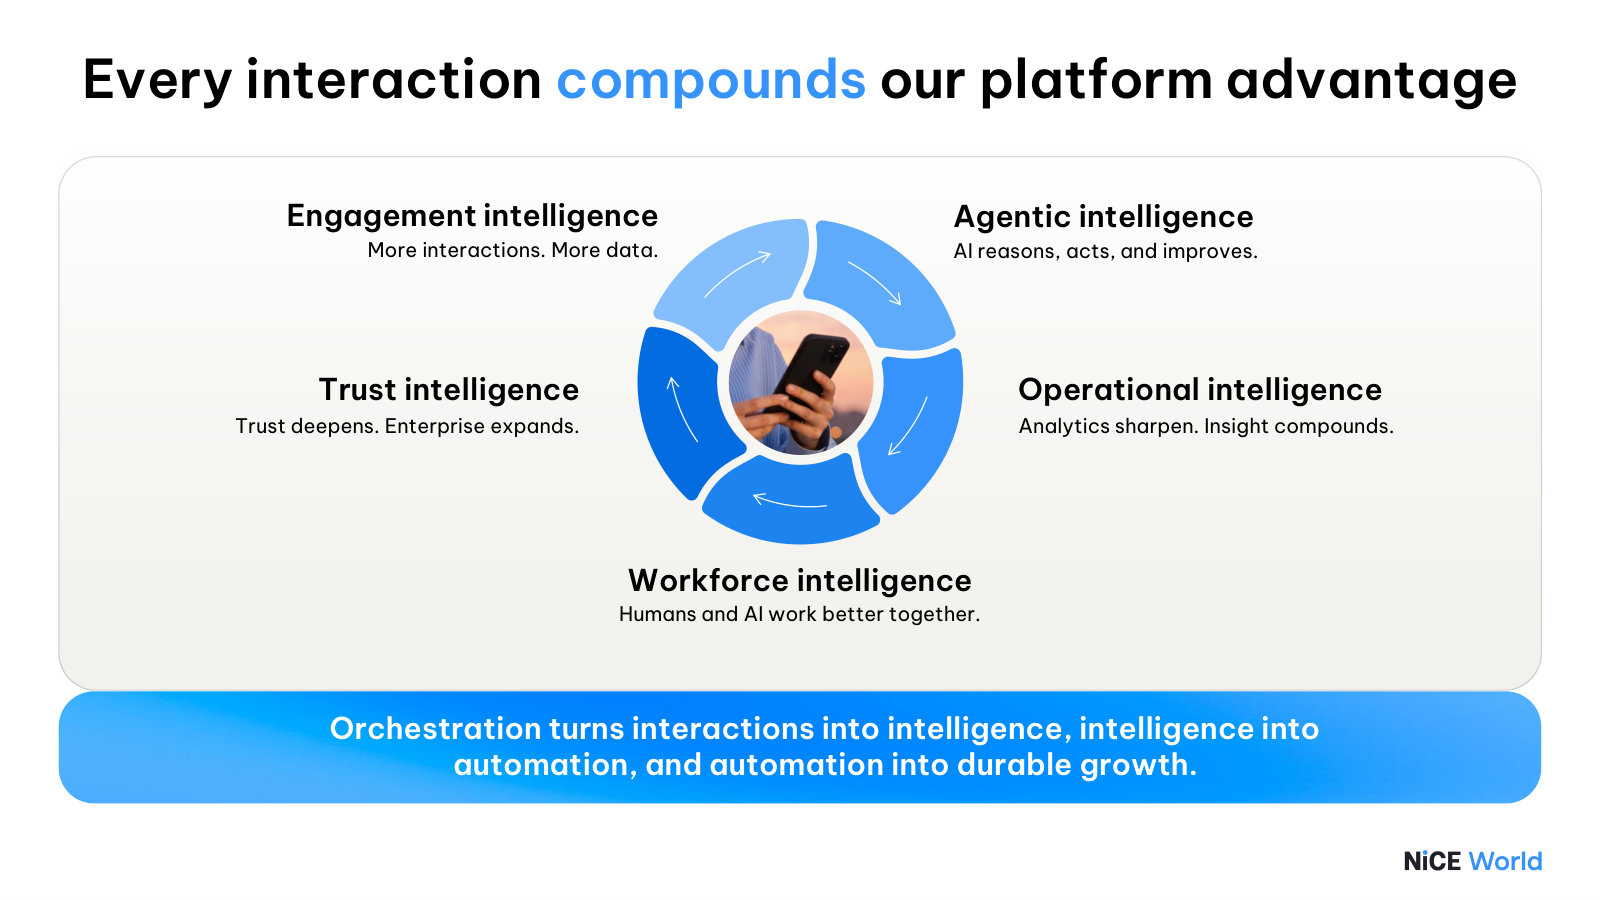
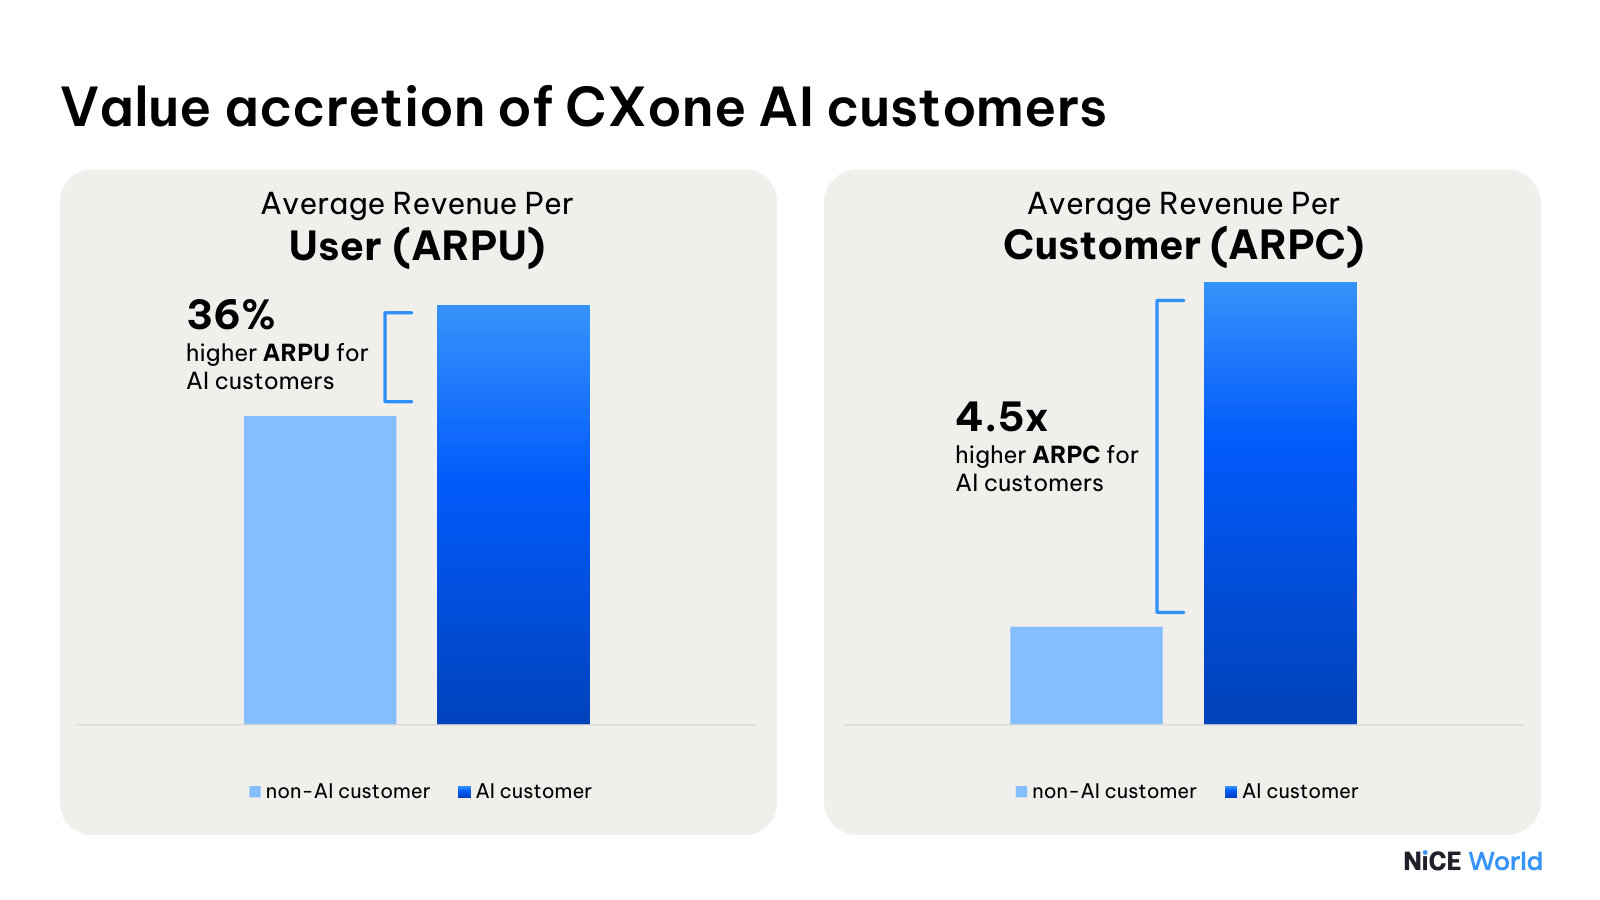
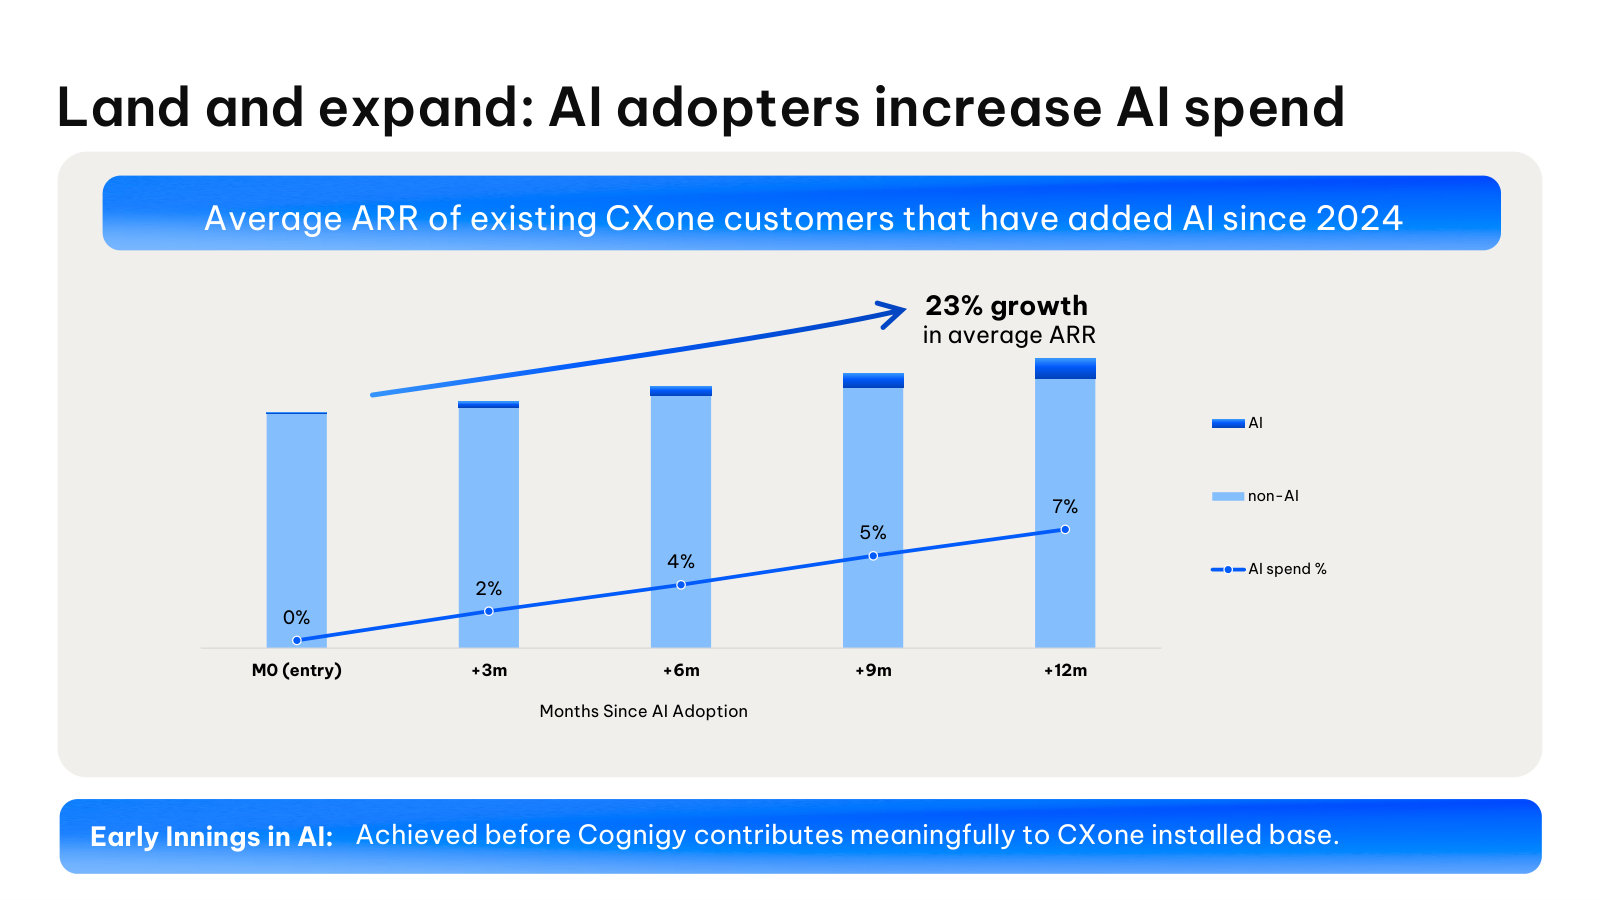
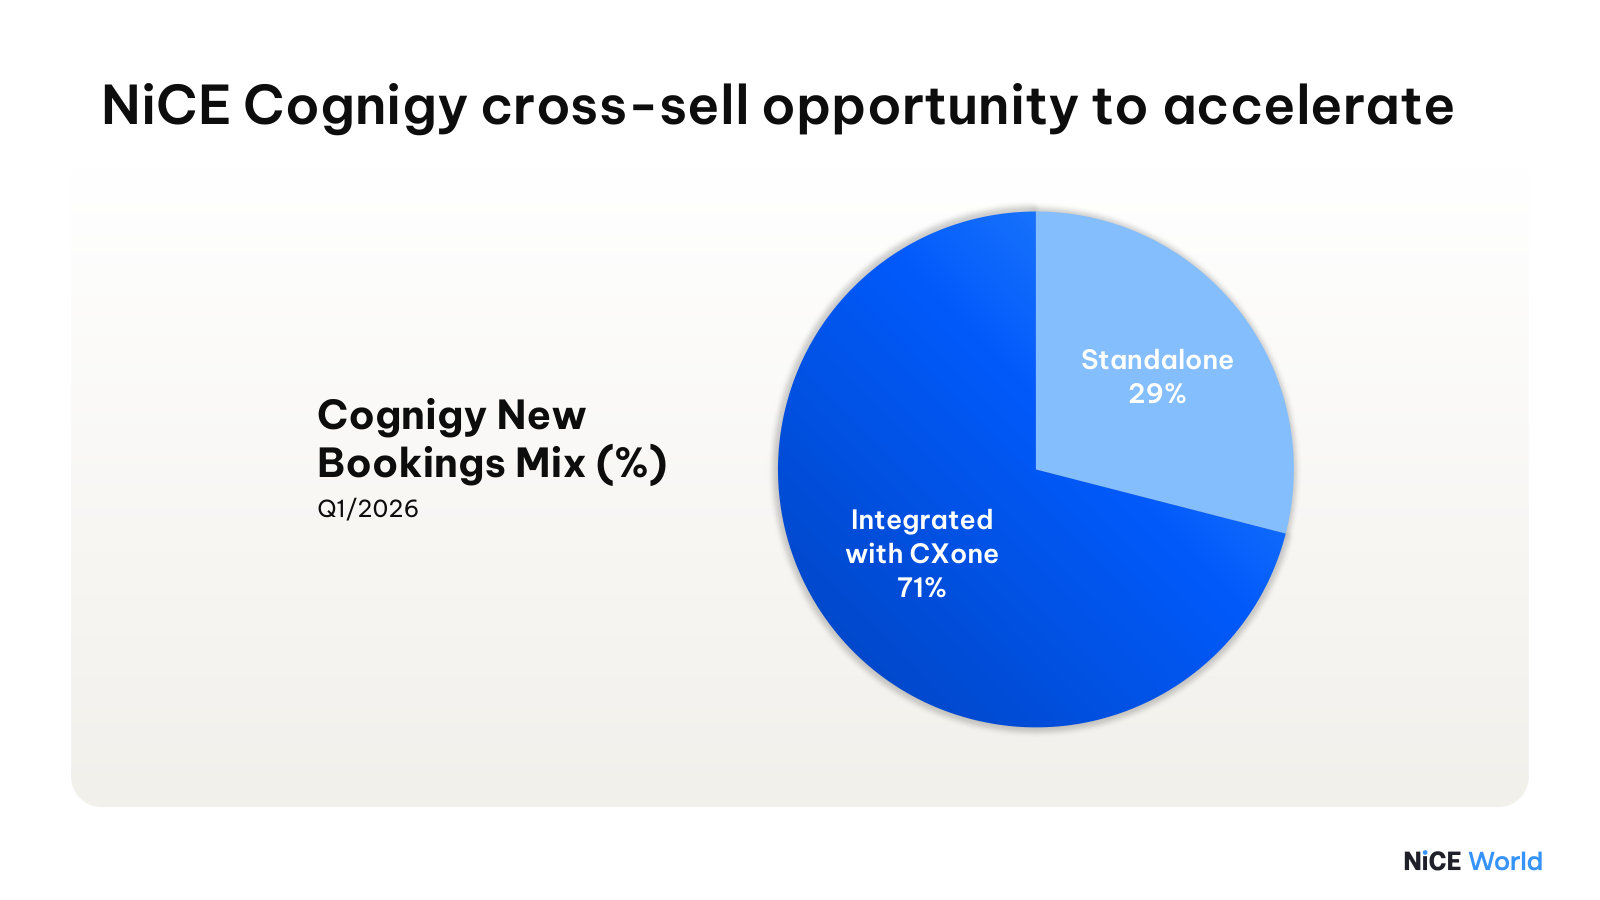
Capital Markets Day 2025 — 2025
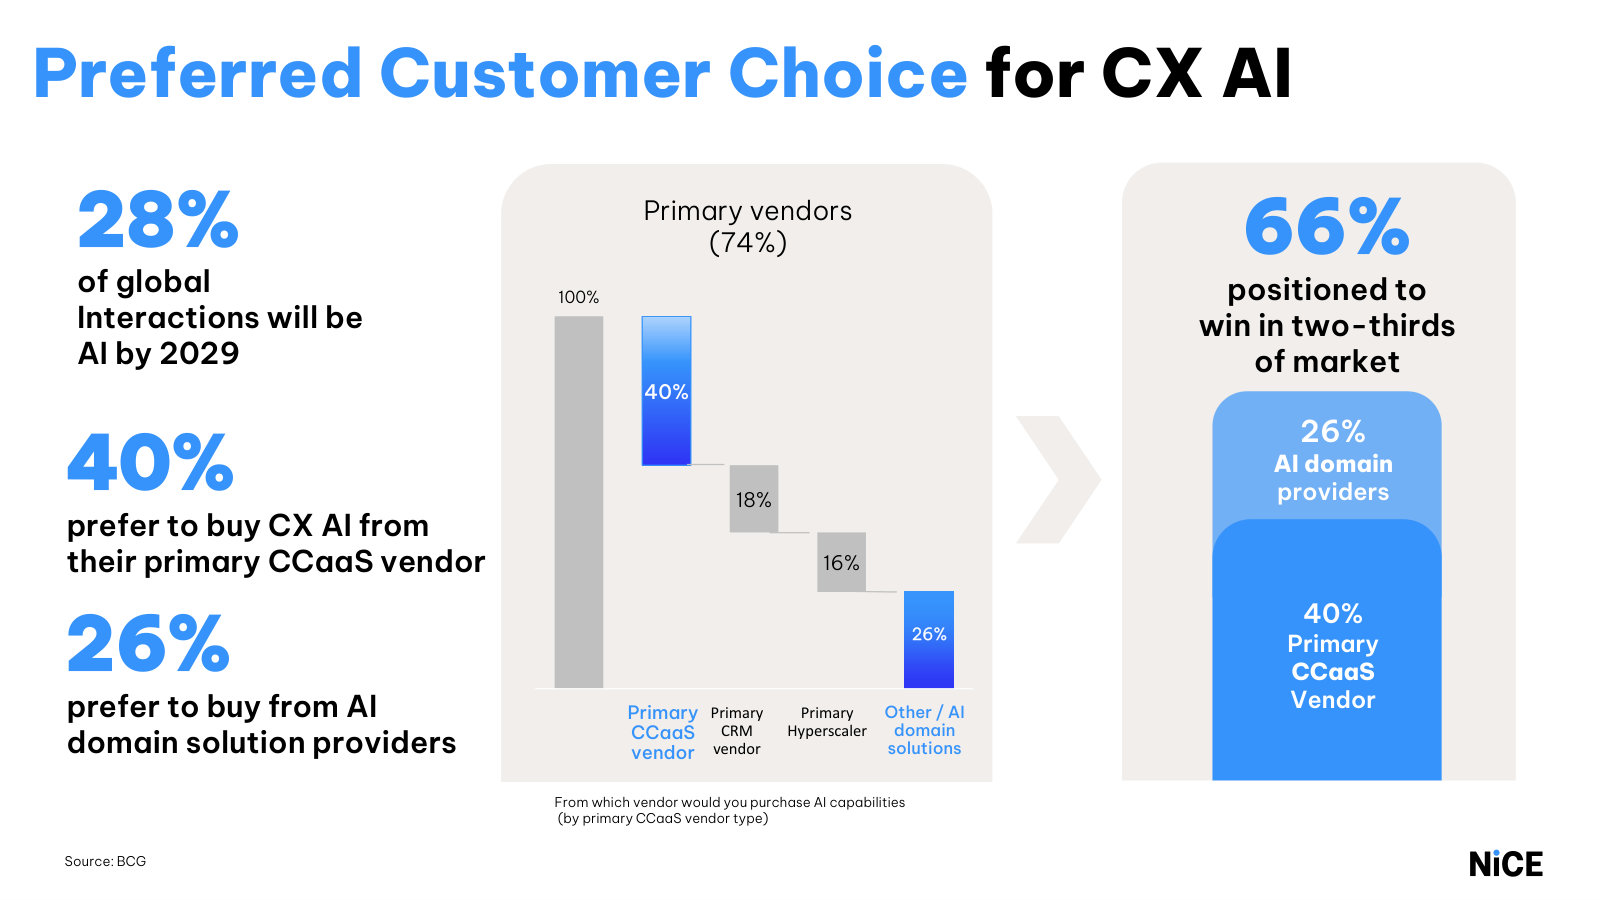
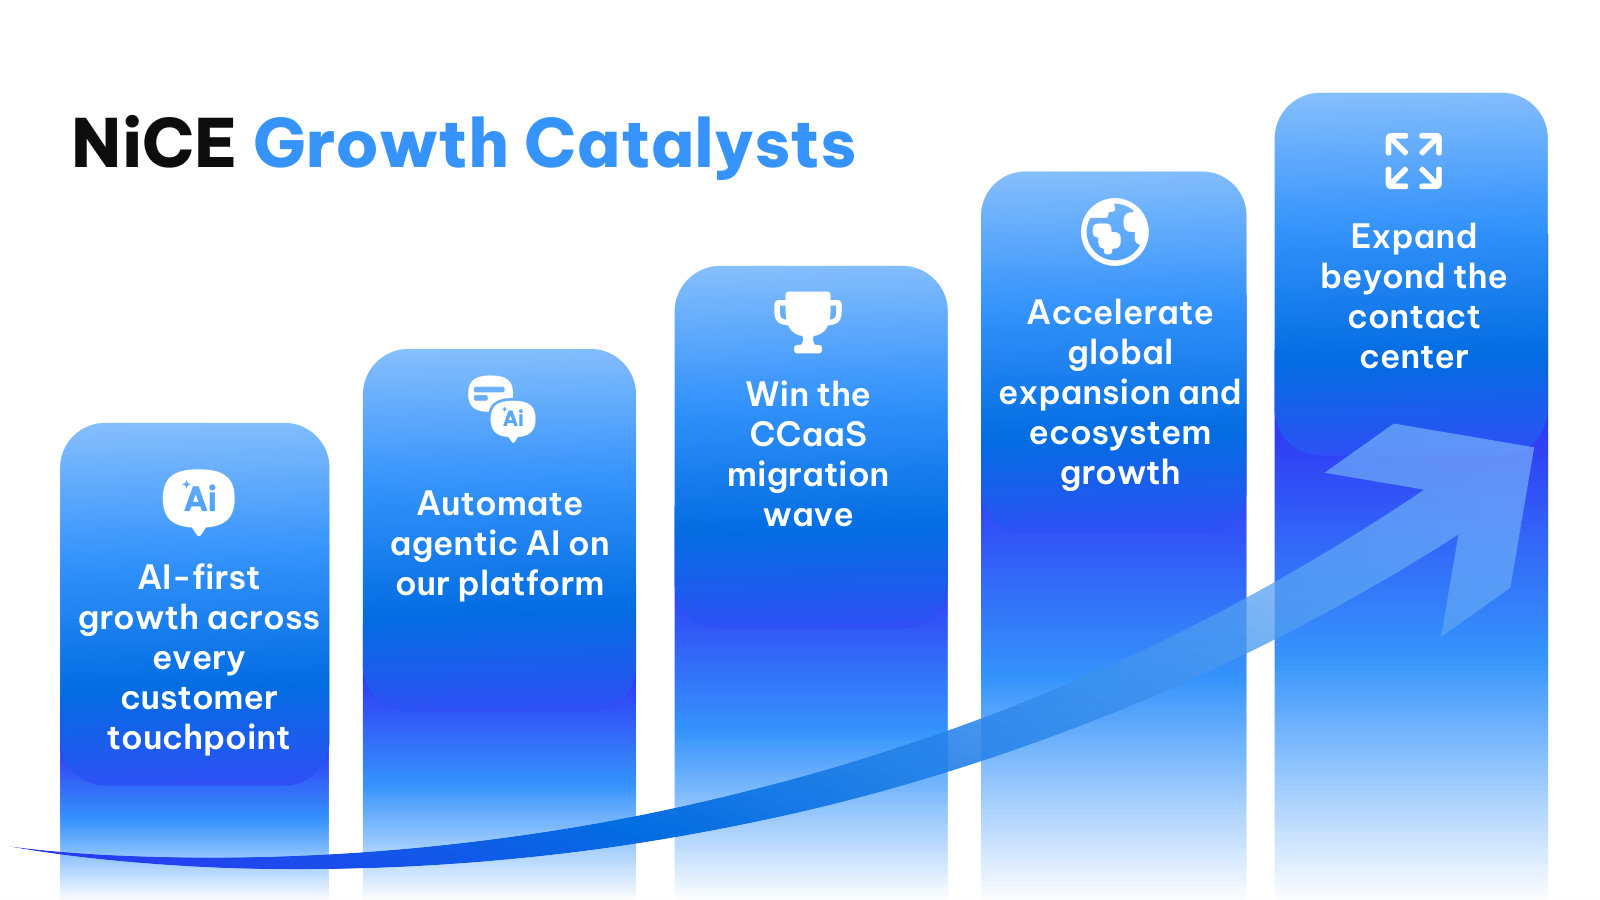
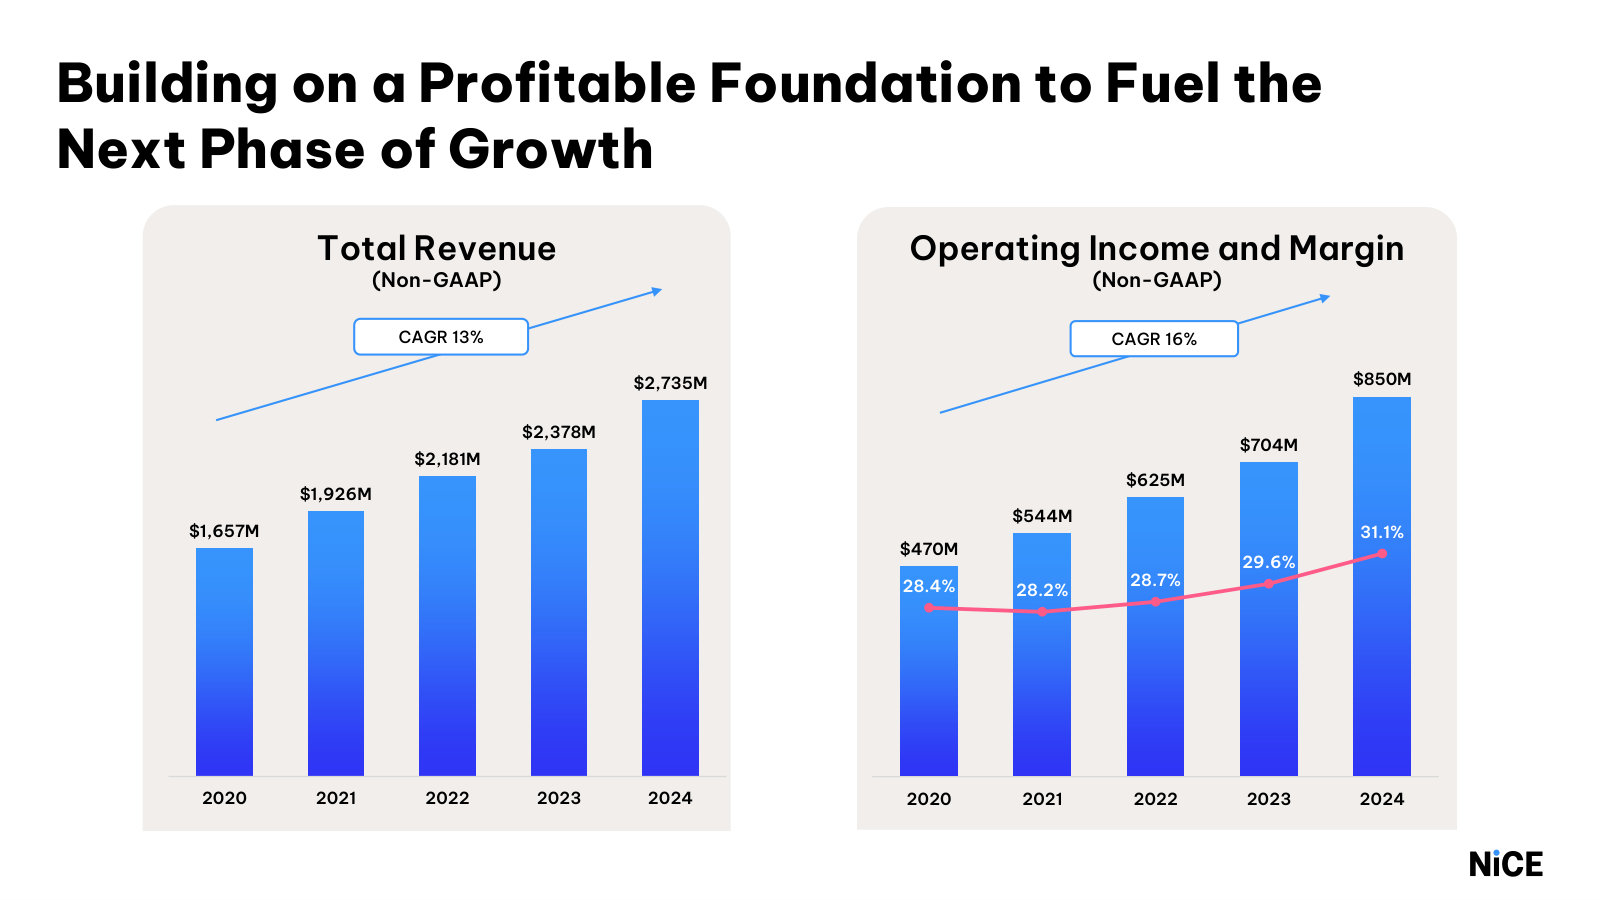
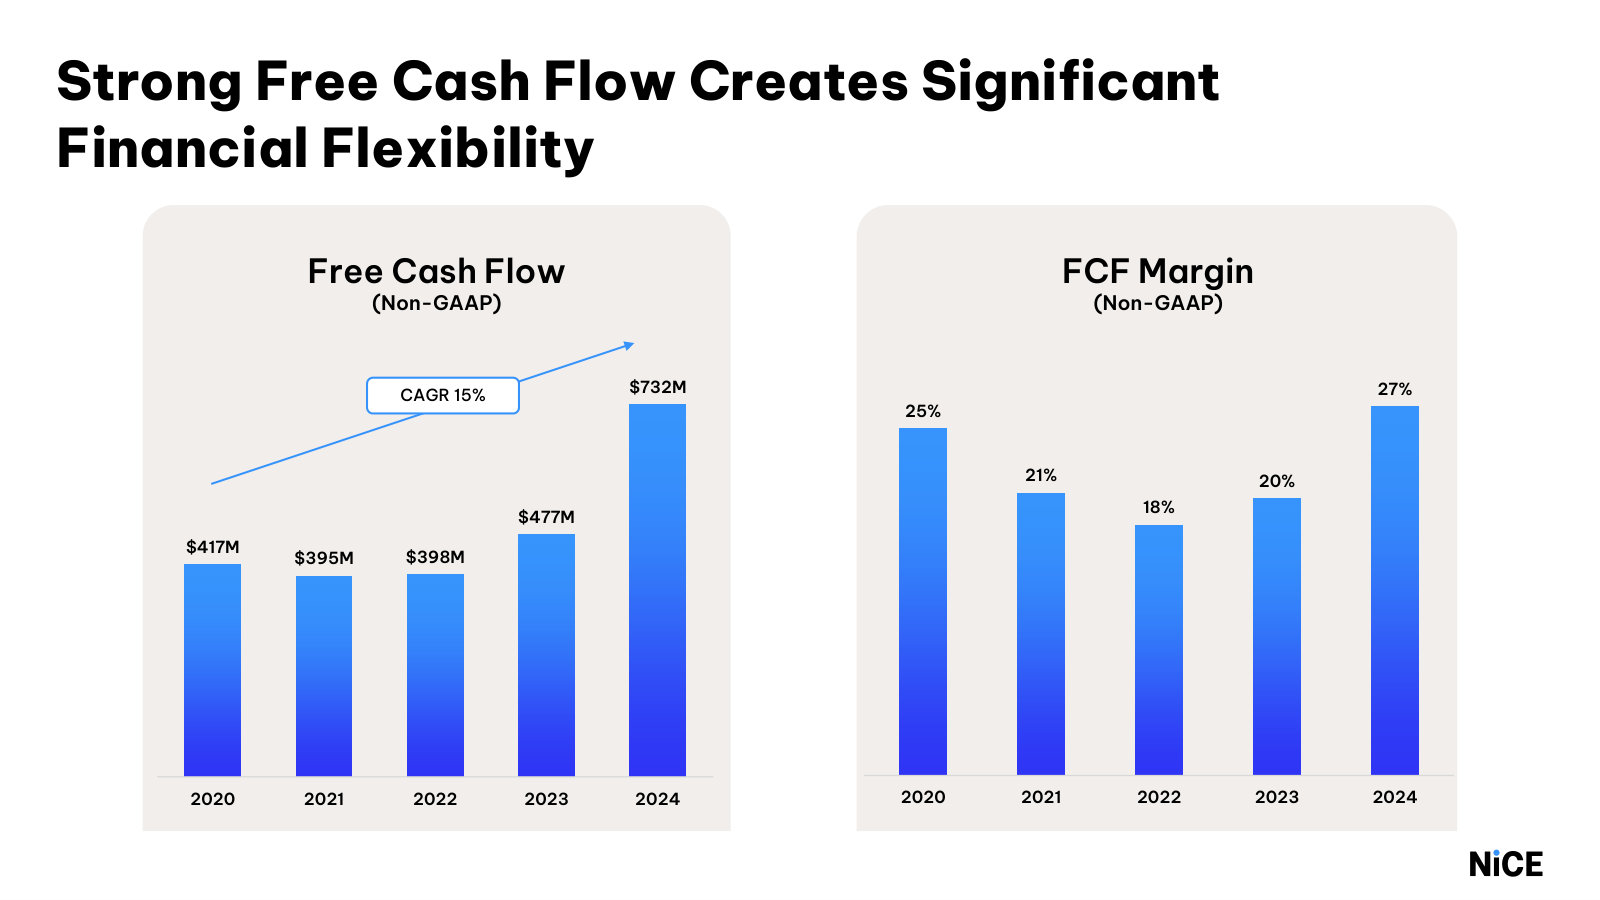
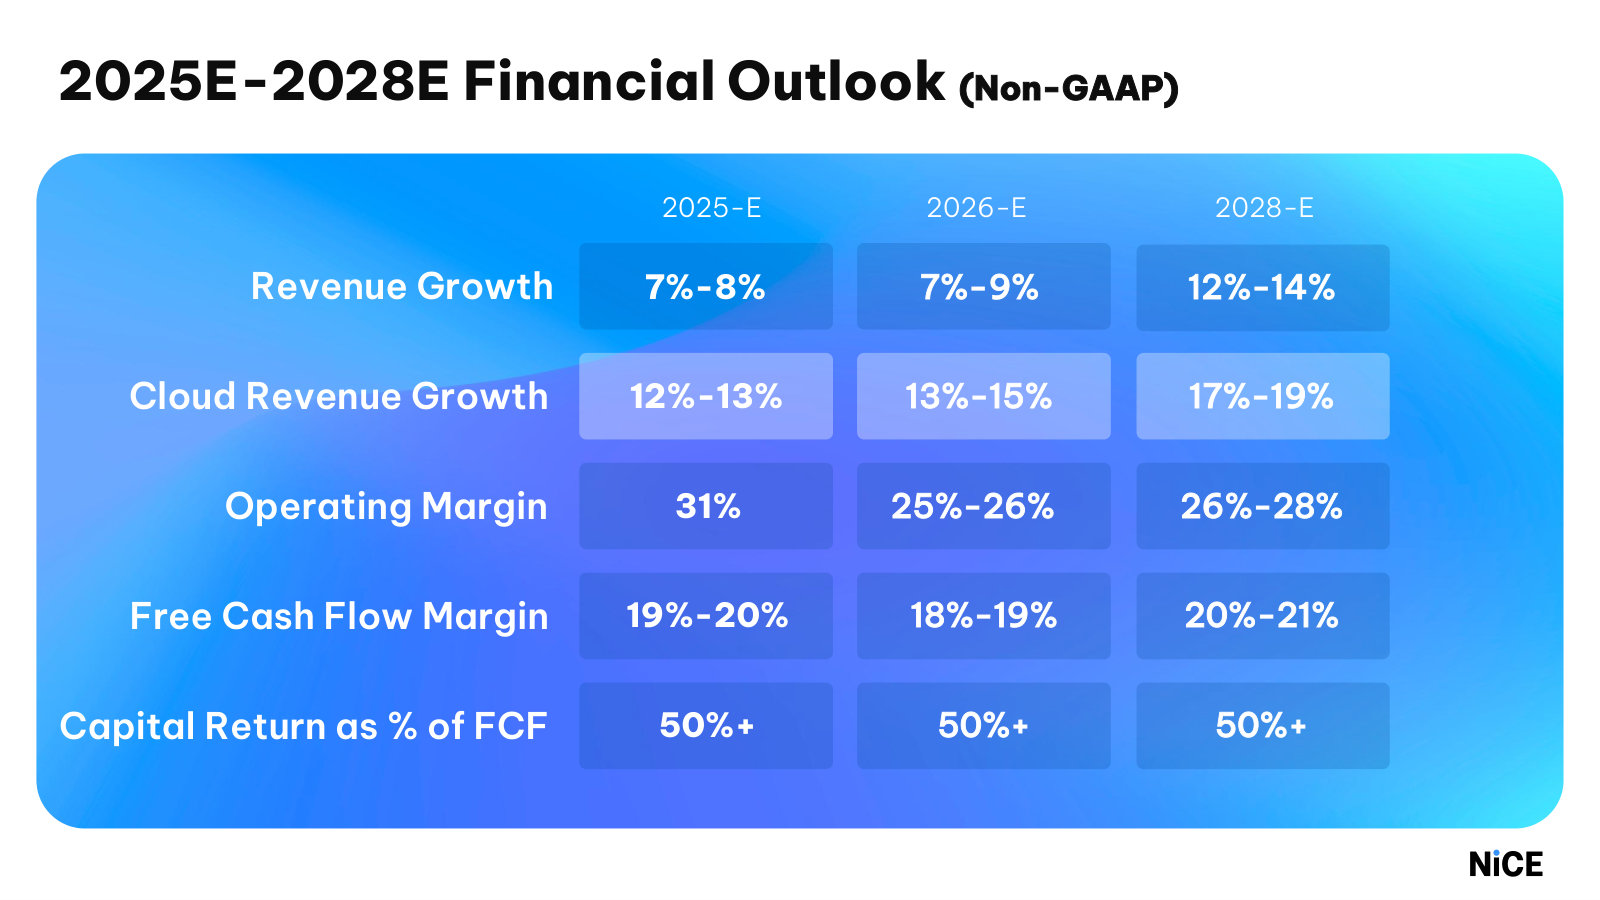
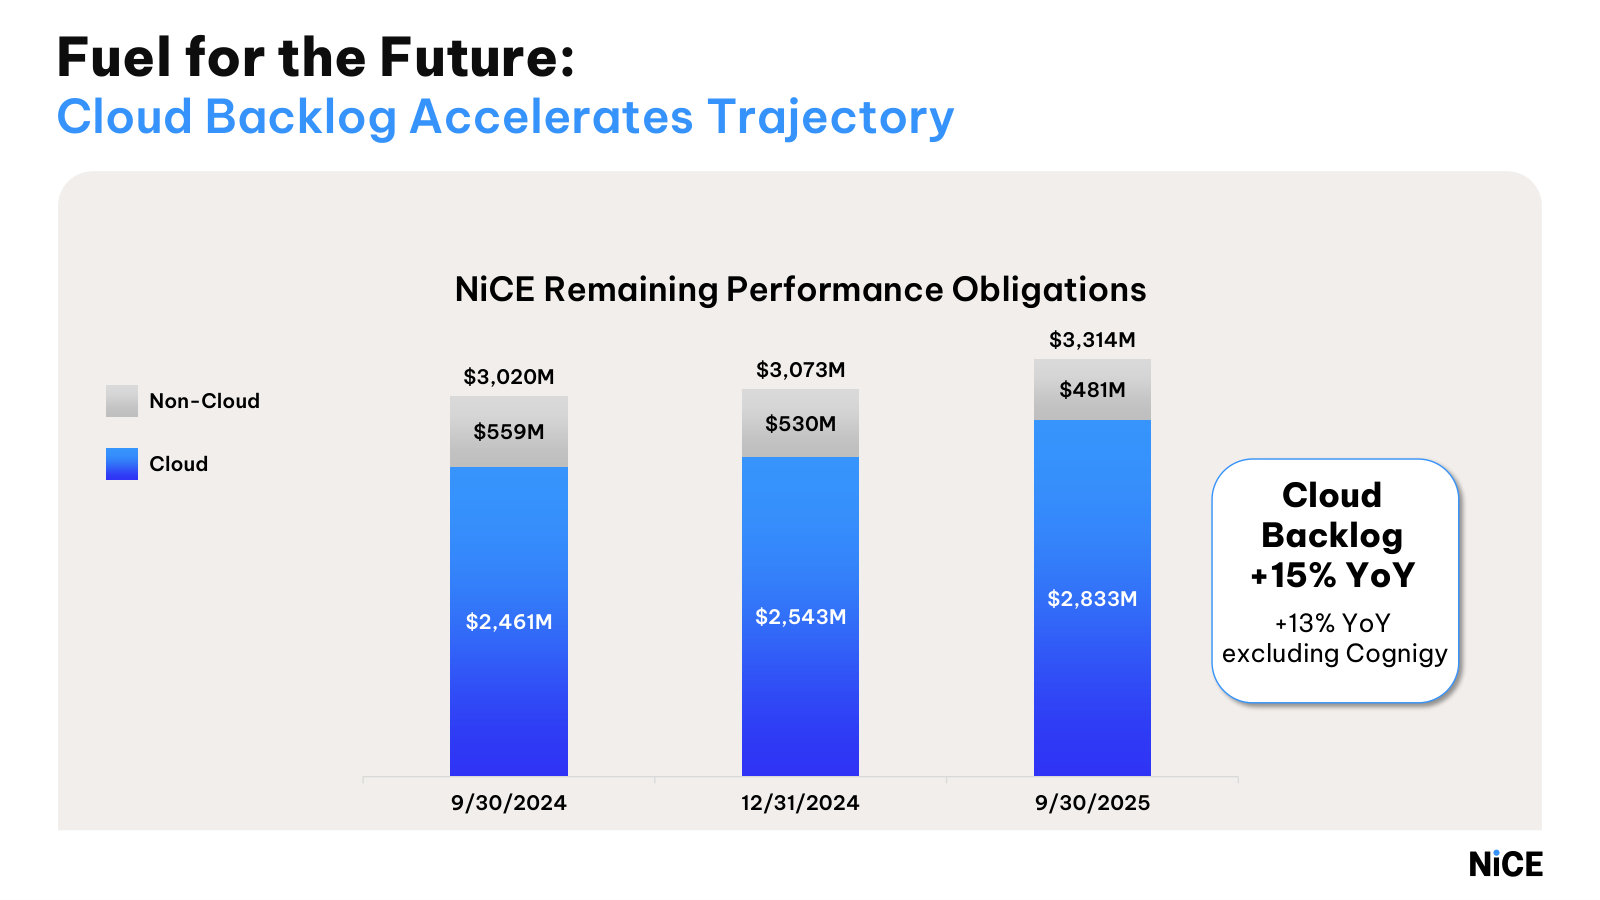
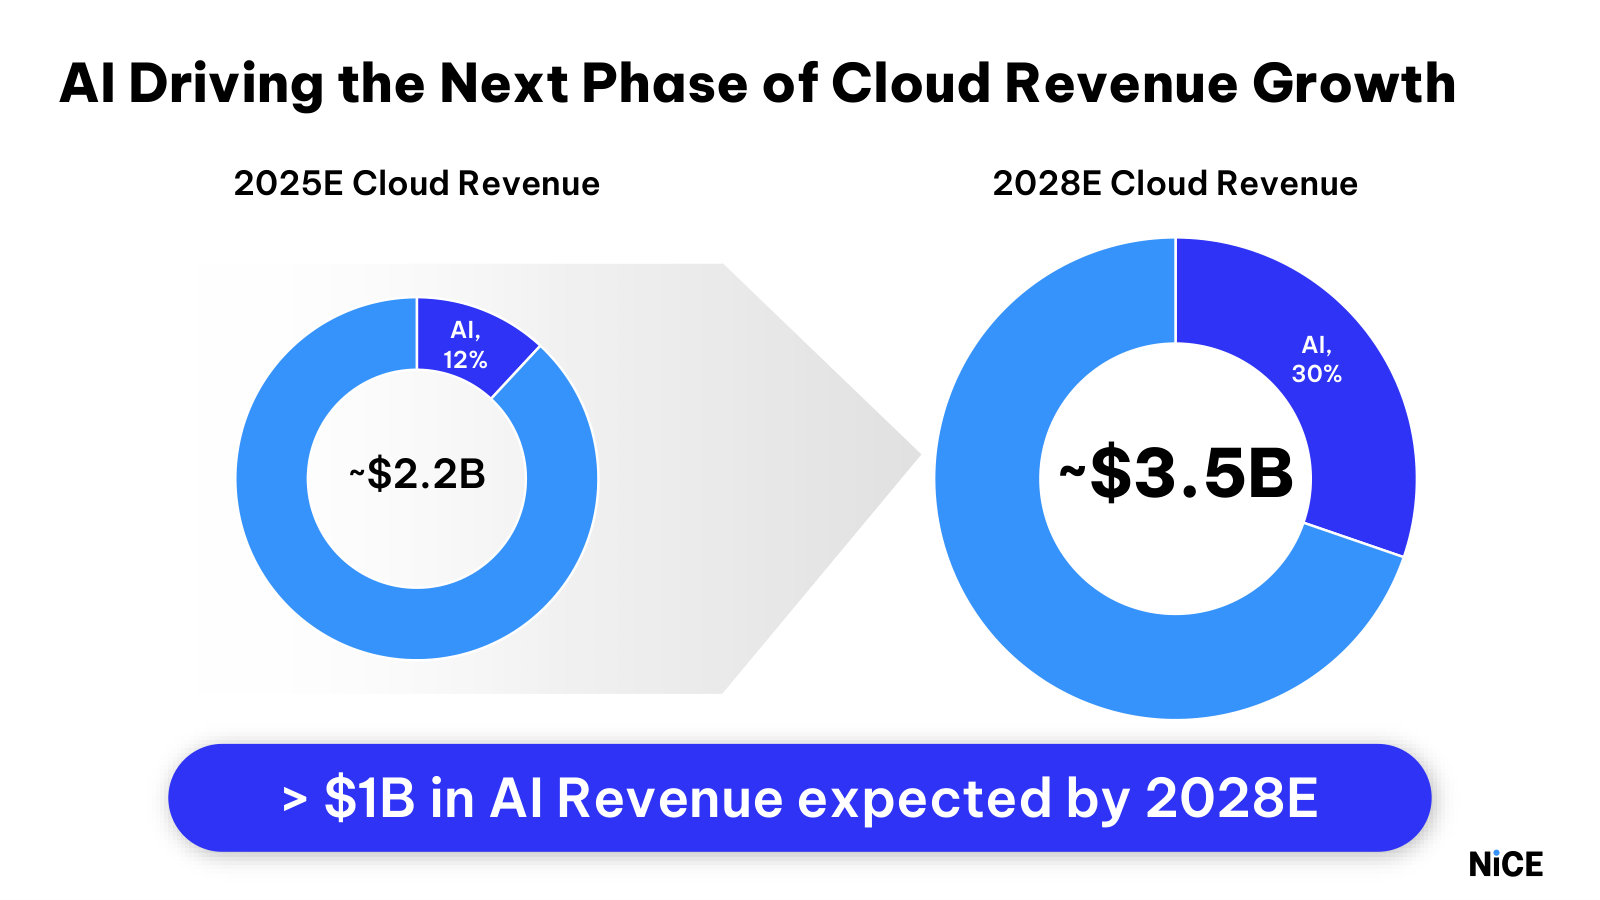
The quantified strategy and financial framework: market sizing, the multi-year targets, and the five-year financial track record. · Open the full document →
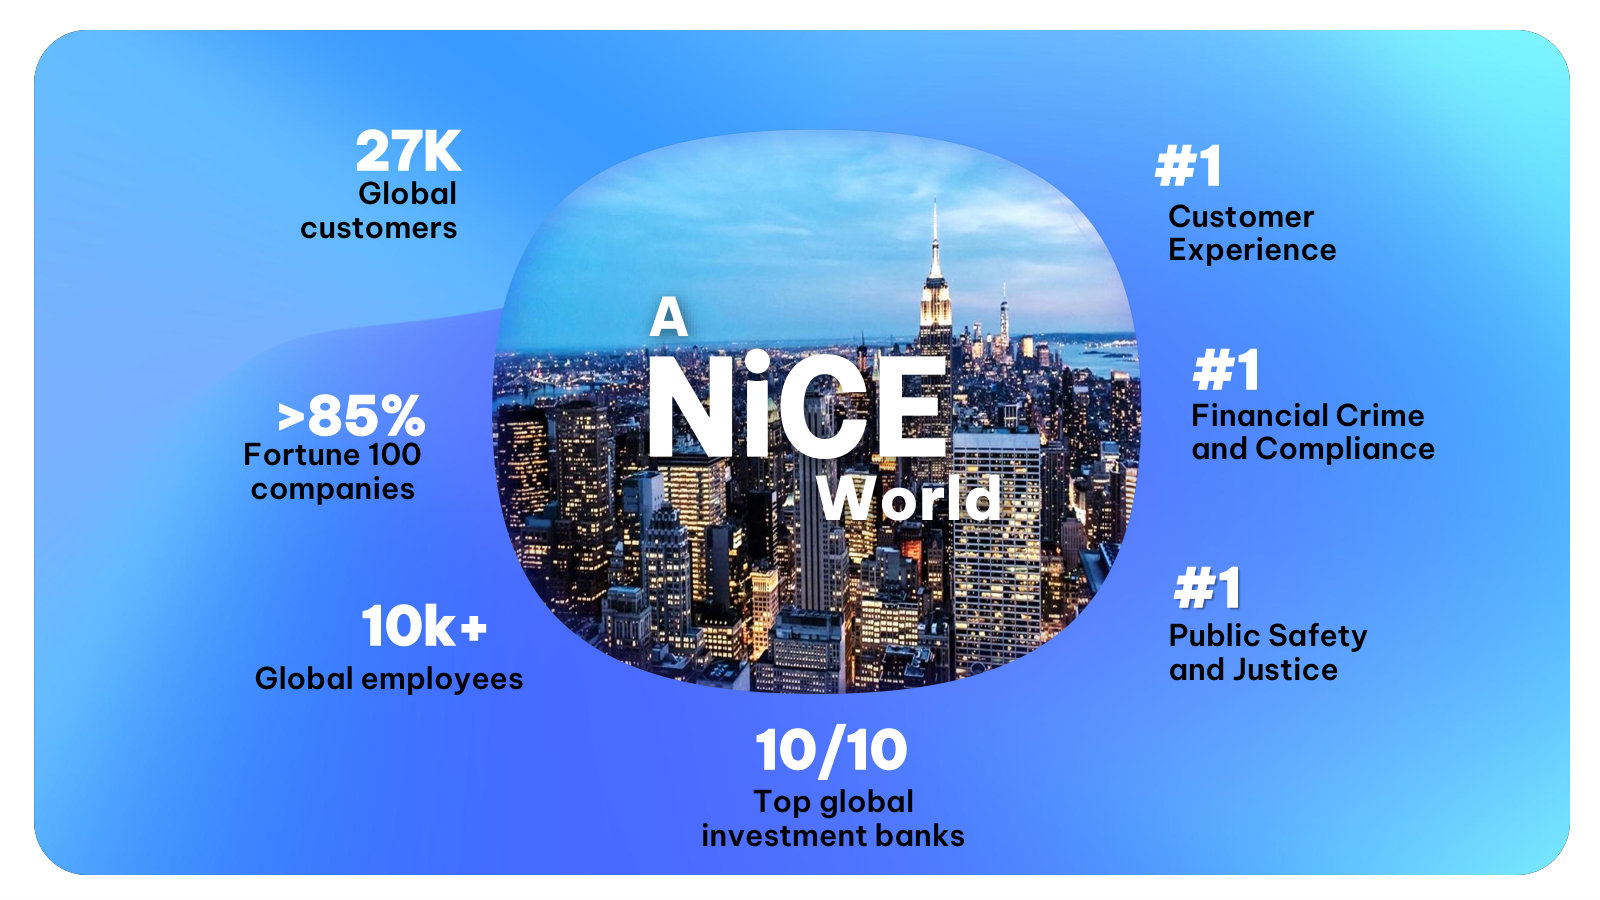
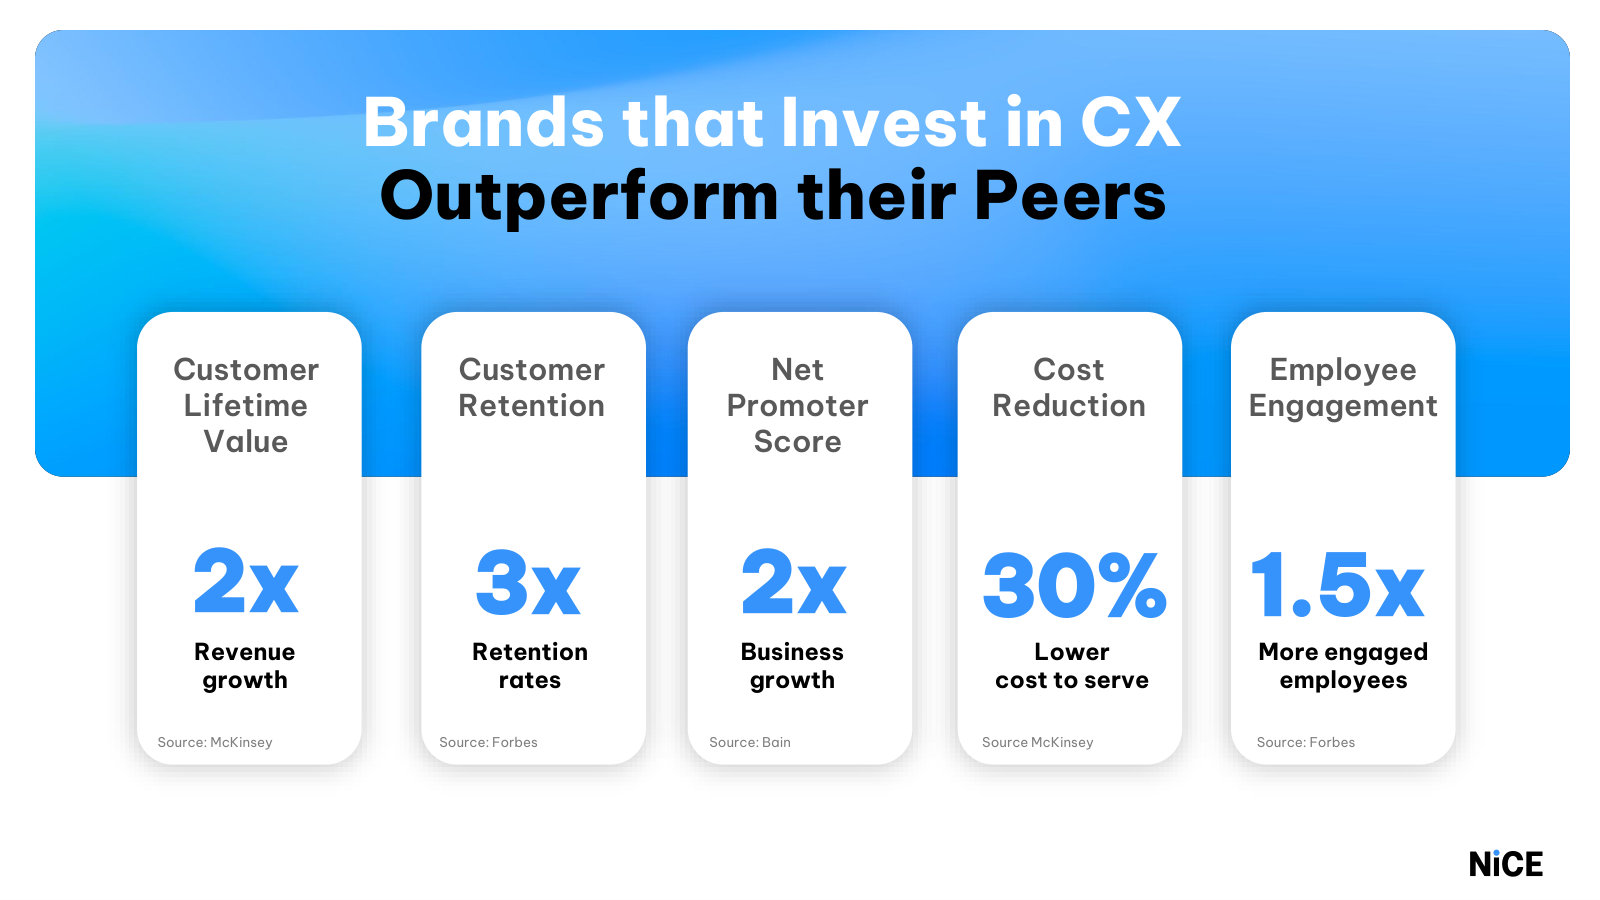
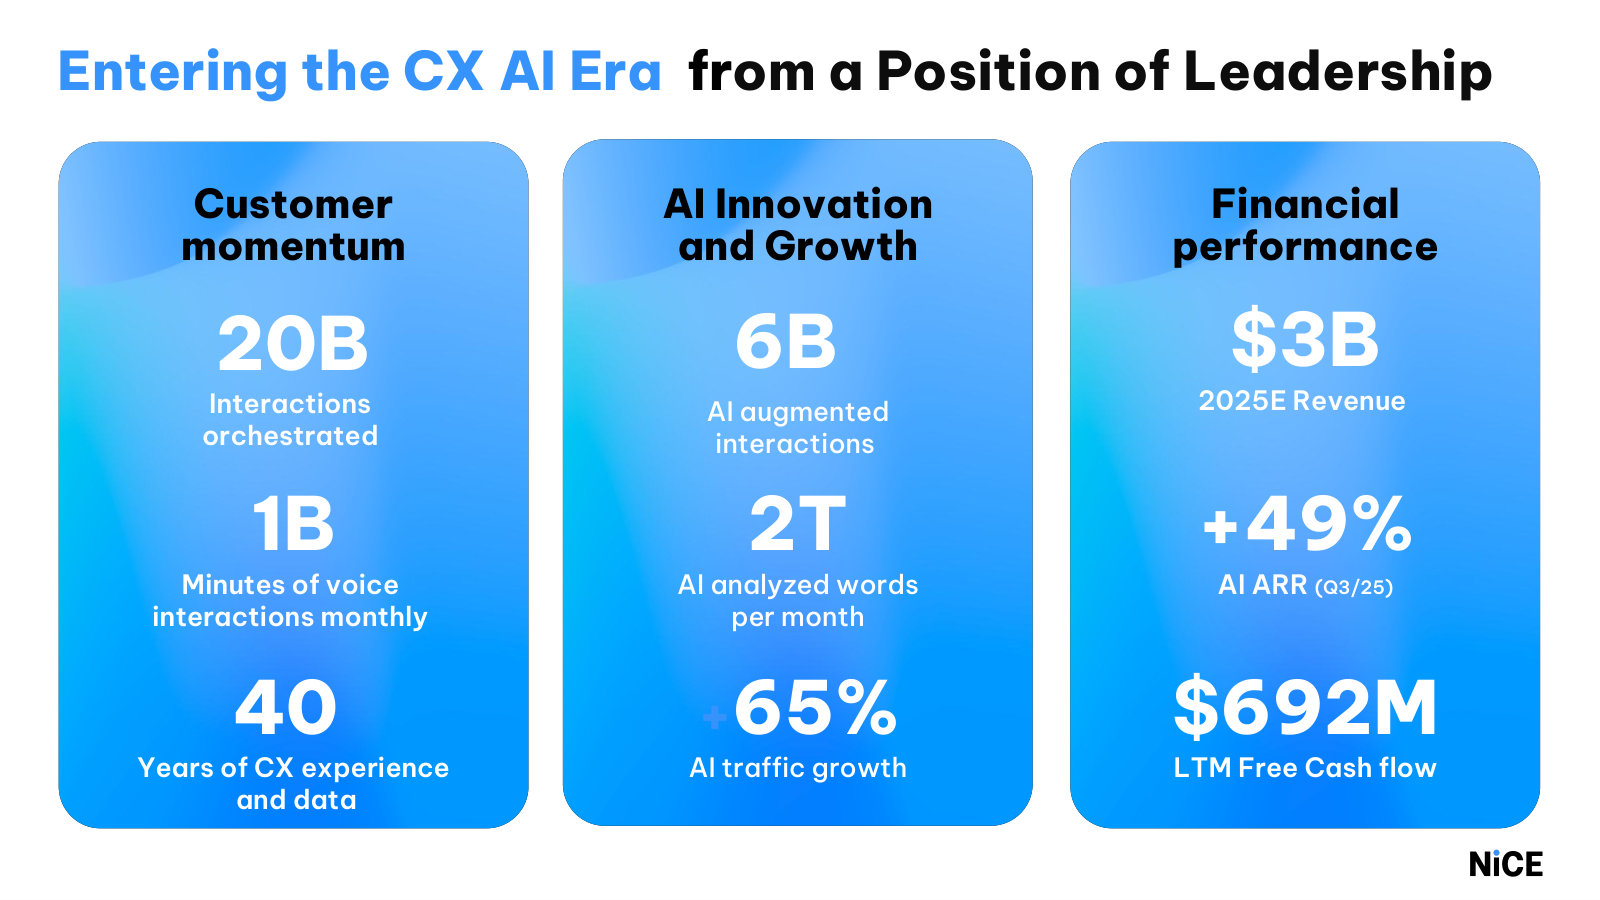
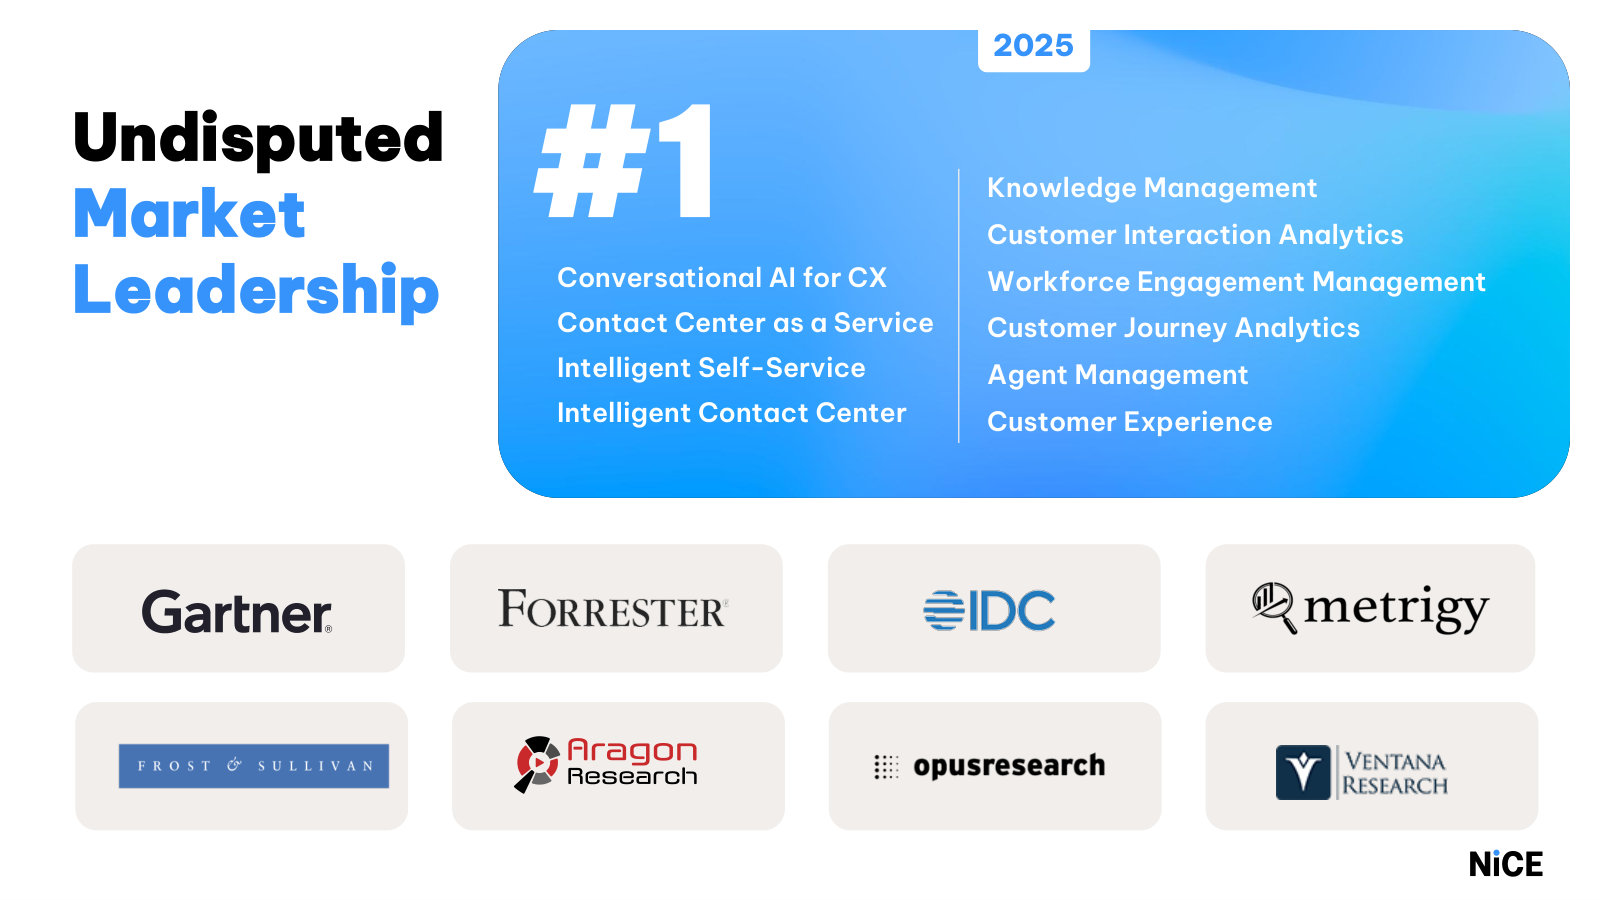
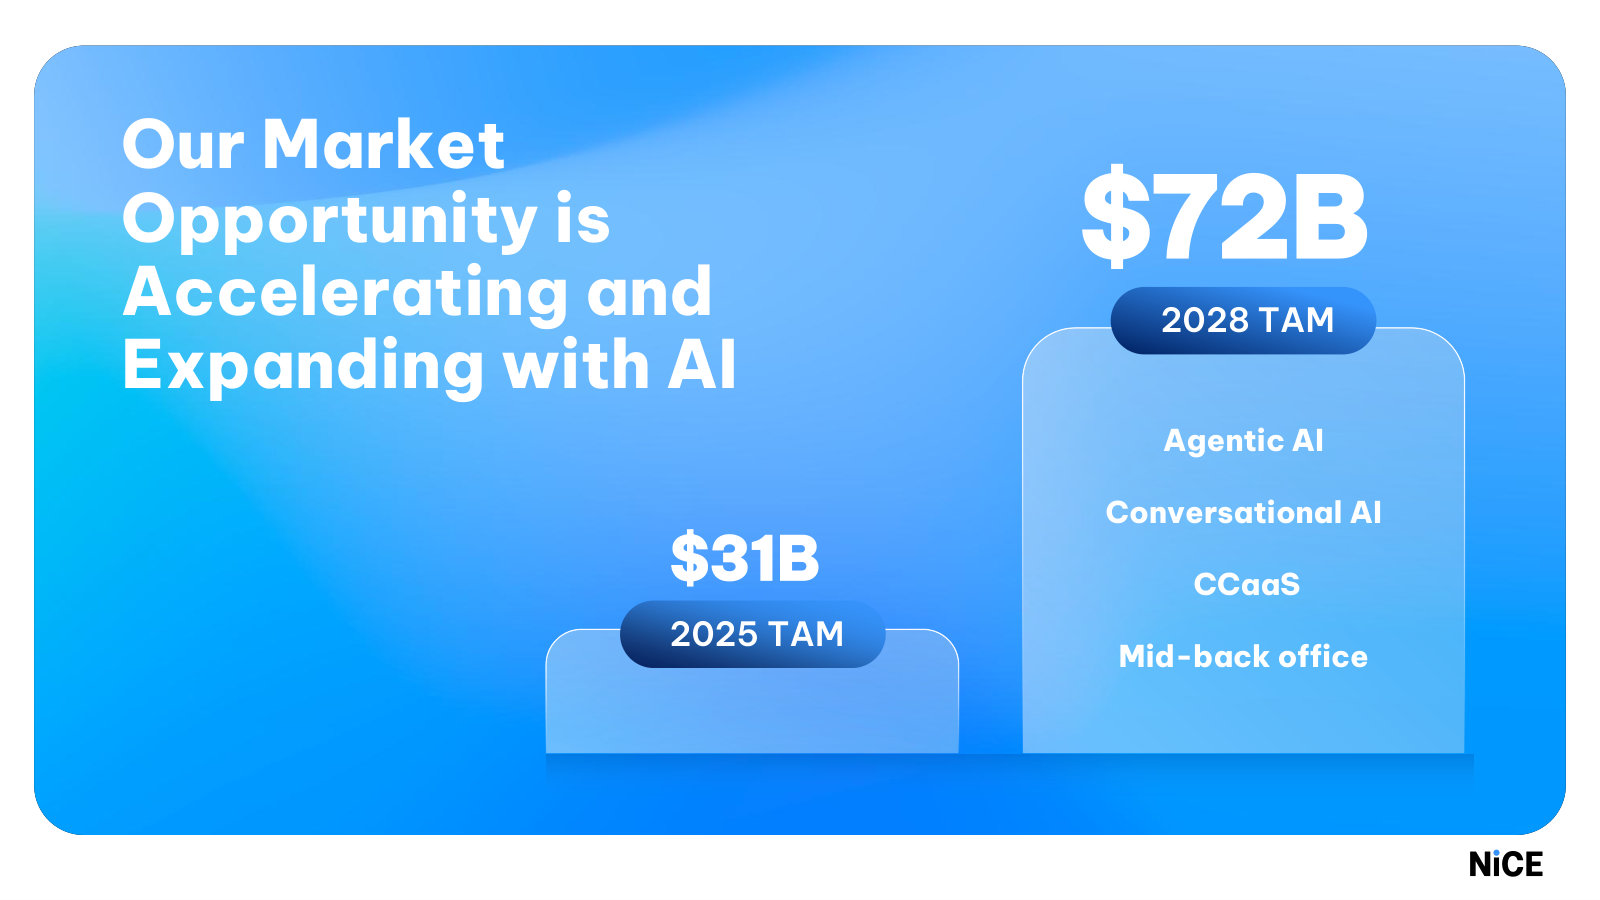
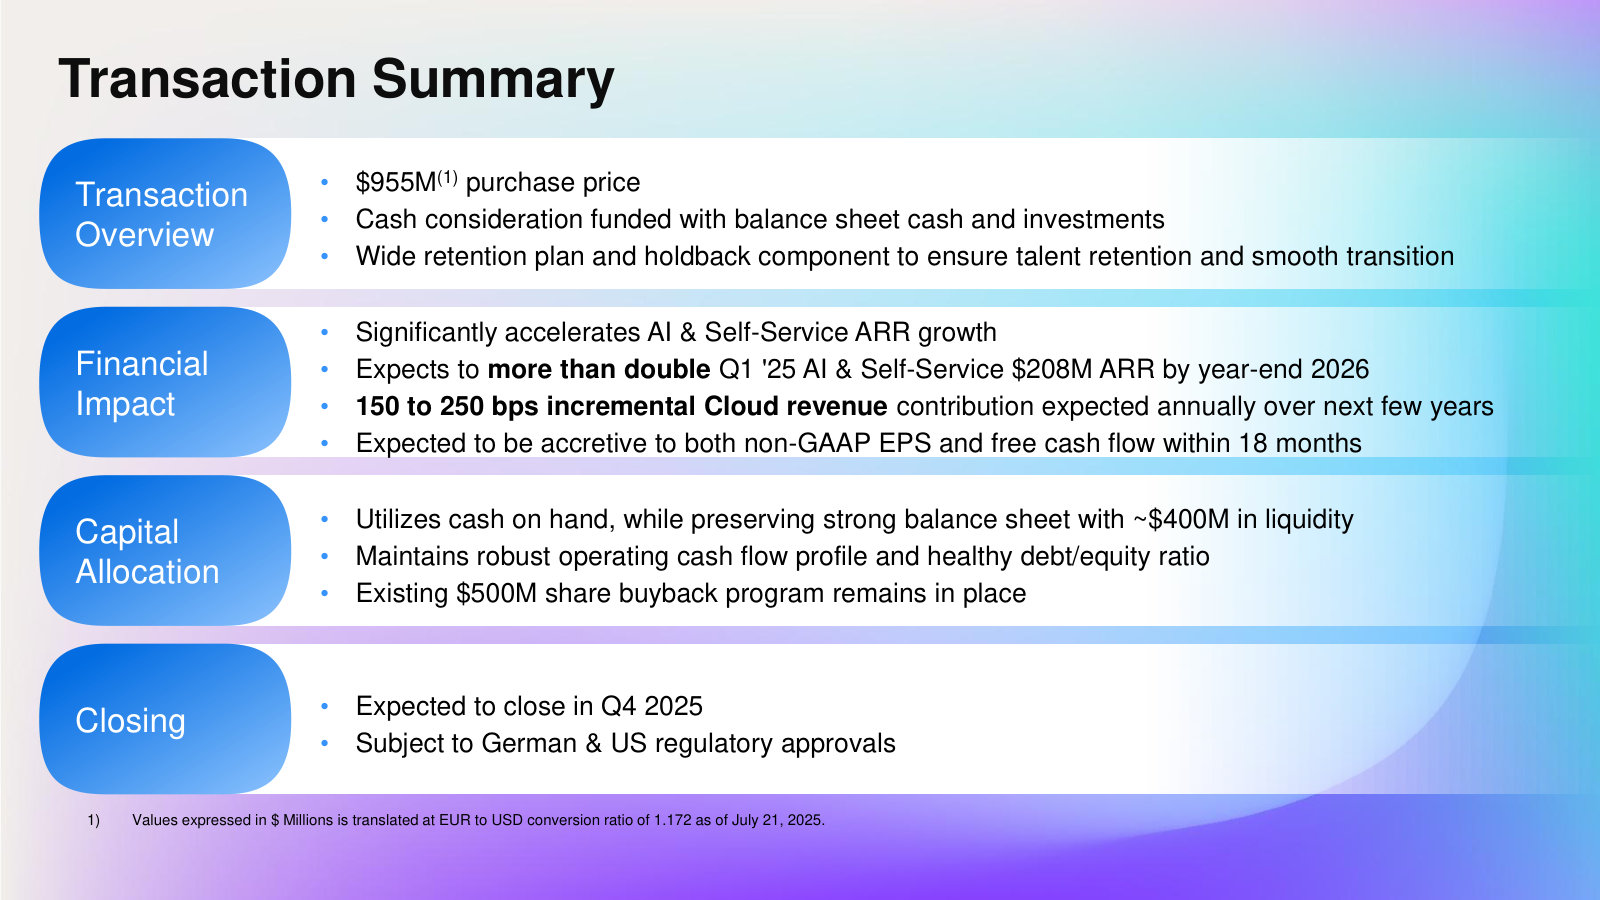
NiCE to Acquire Cognigy — Investor Presentation — 2025
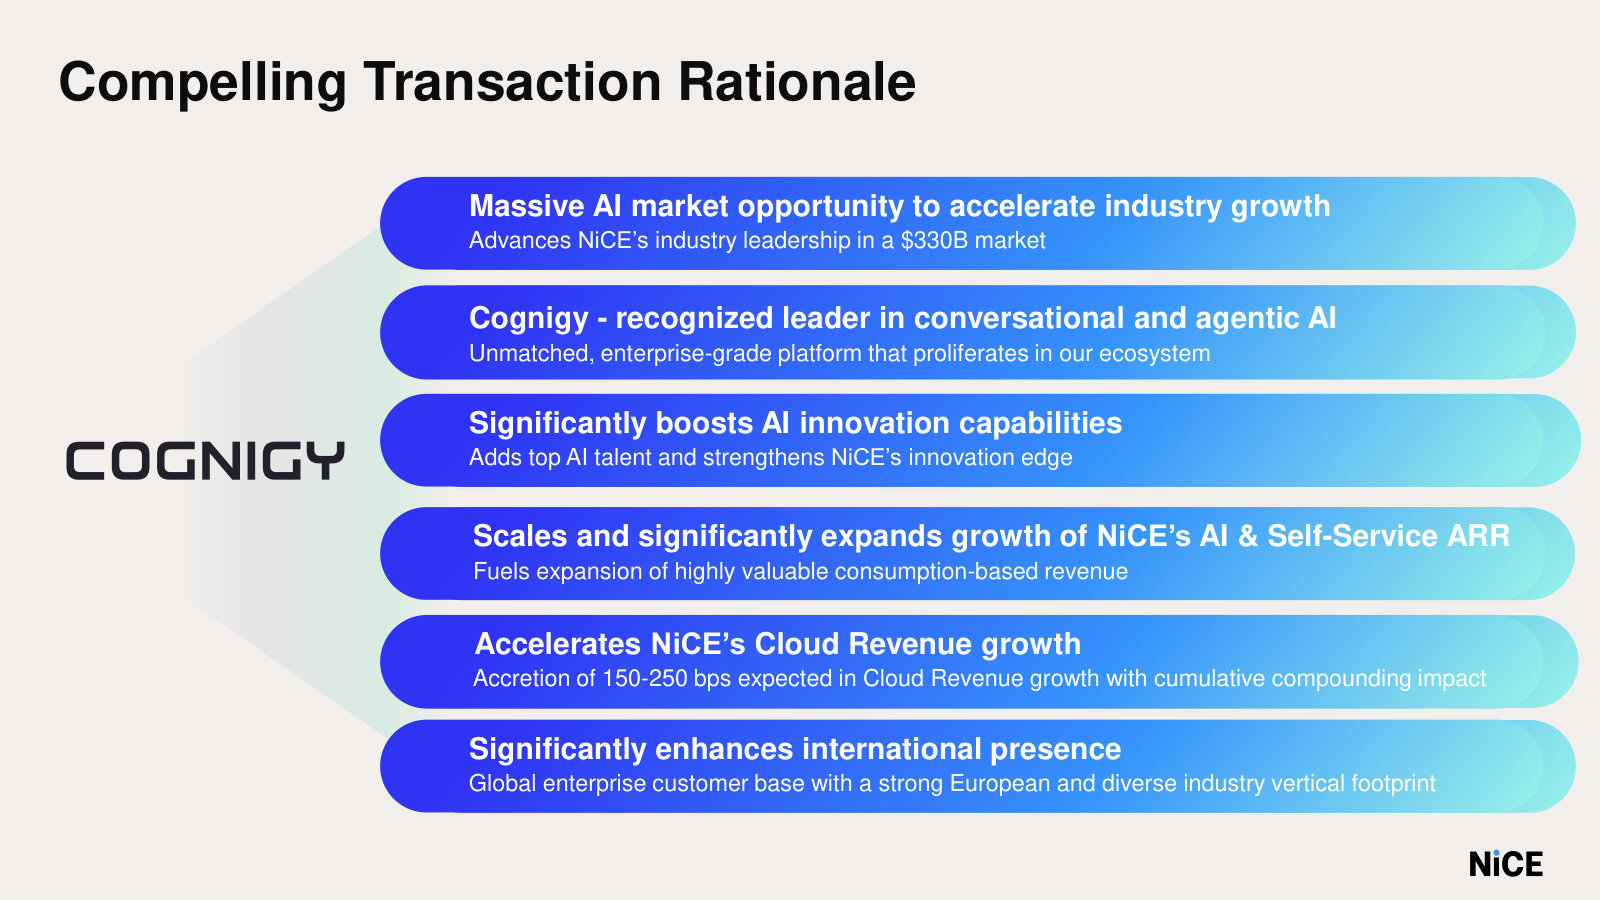
The rationale, terms and metrics of NiCE's largest recent acquisition, now core to the AI platform. · Open the full document →
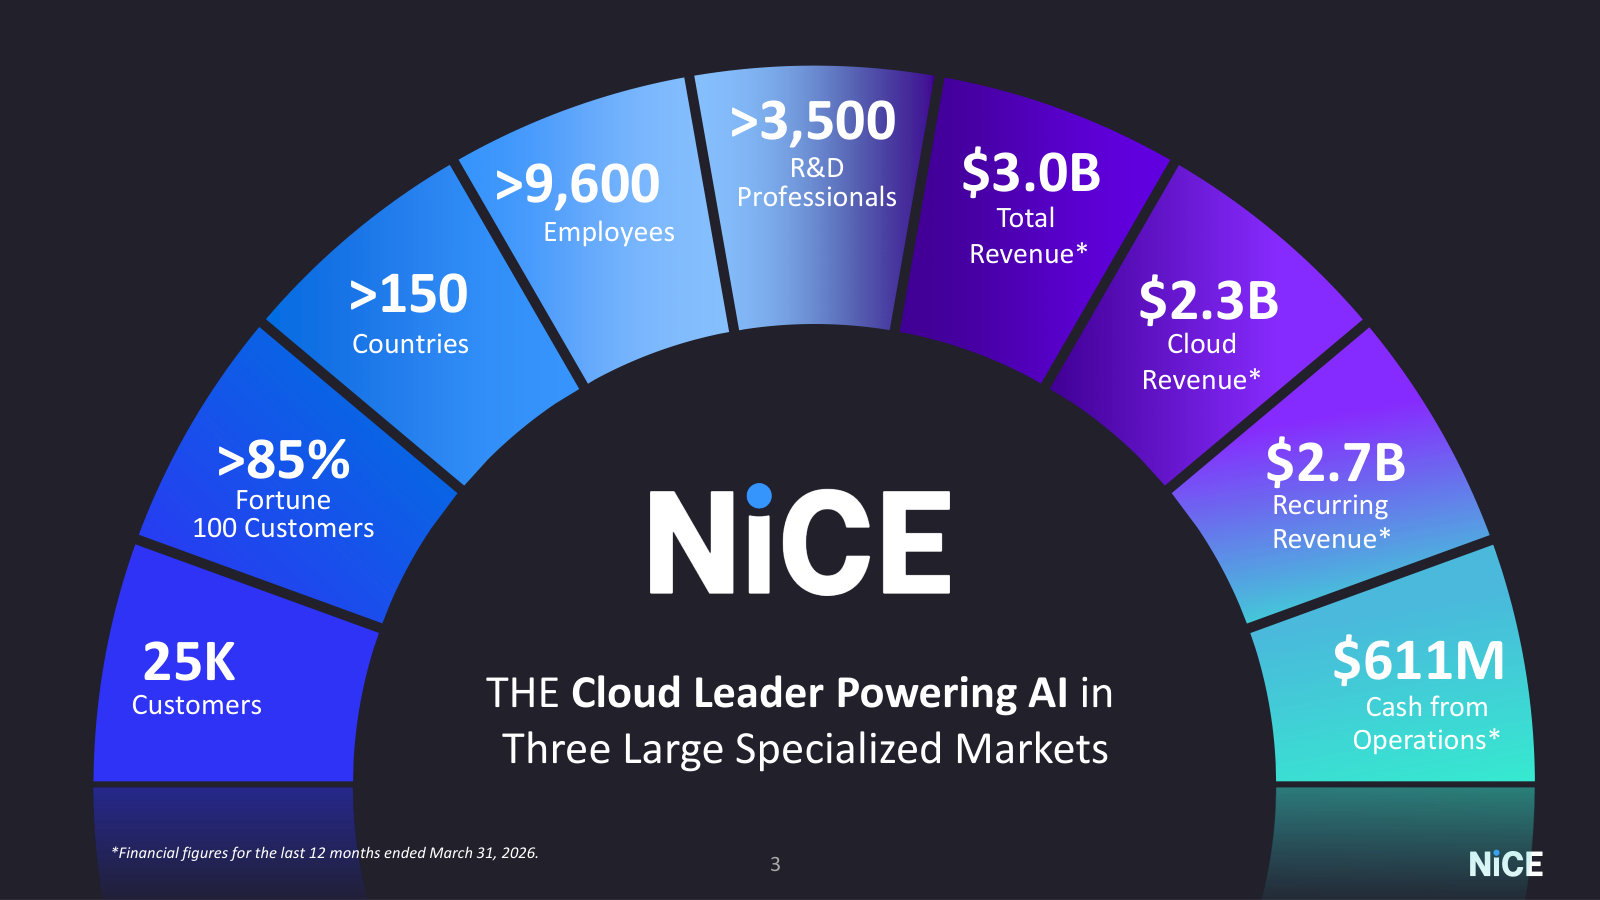
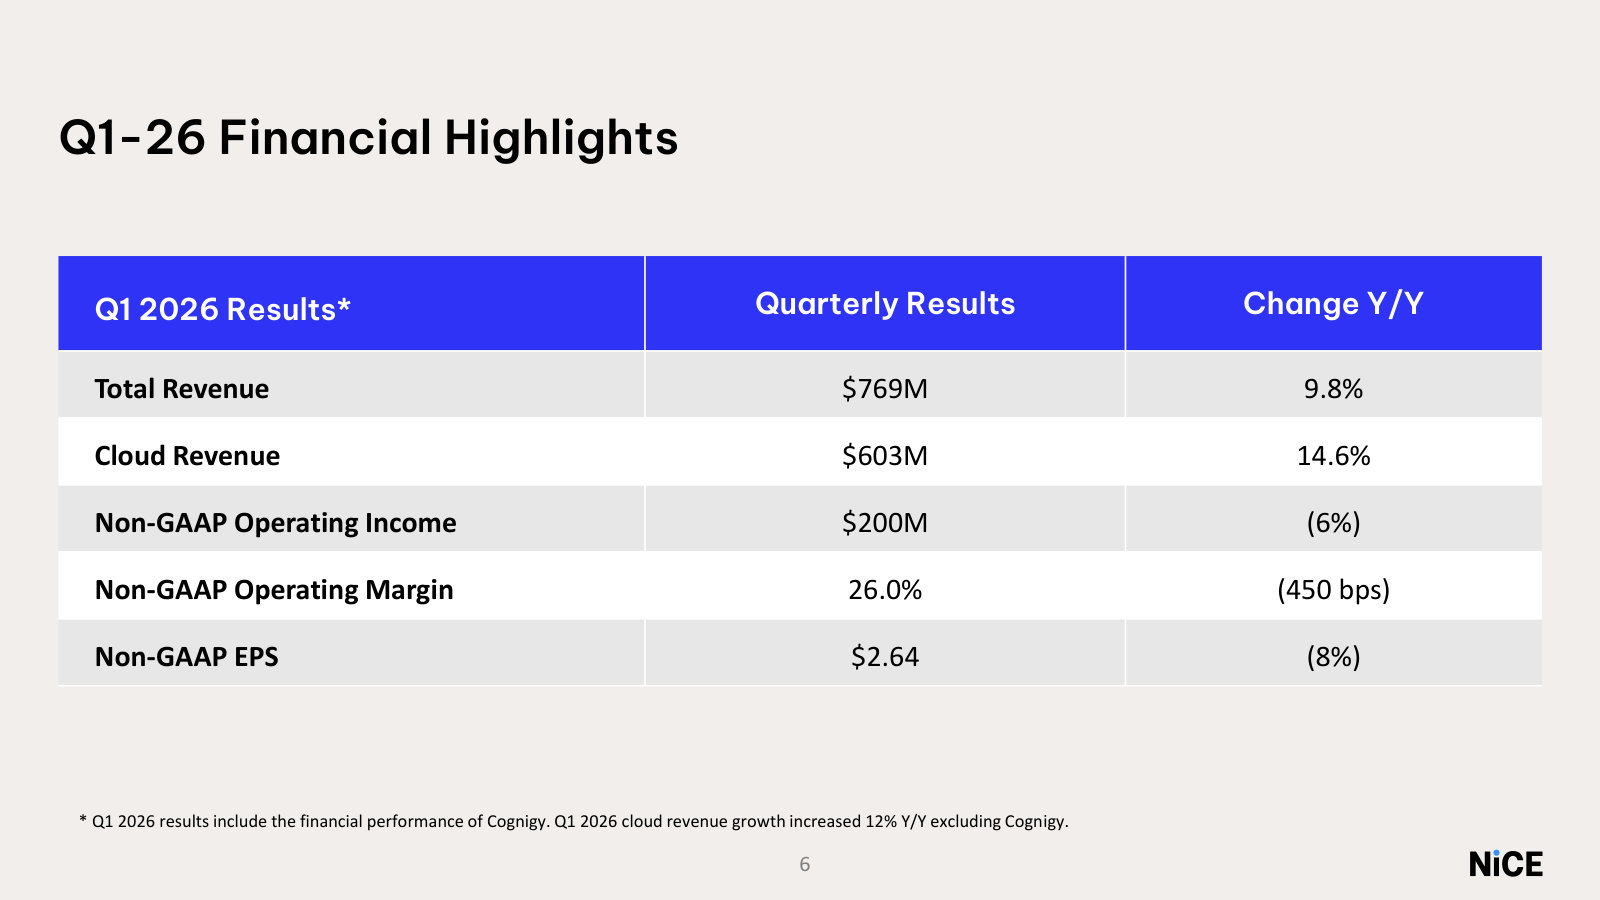
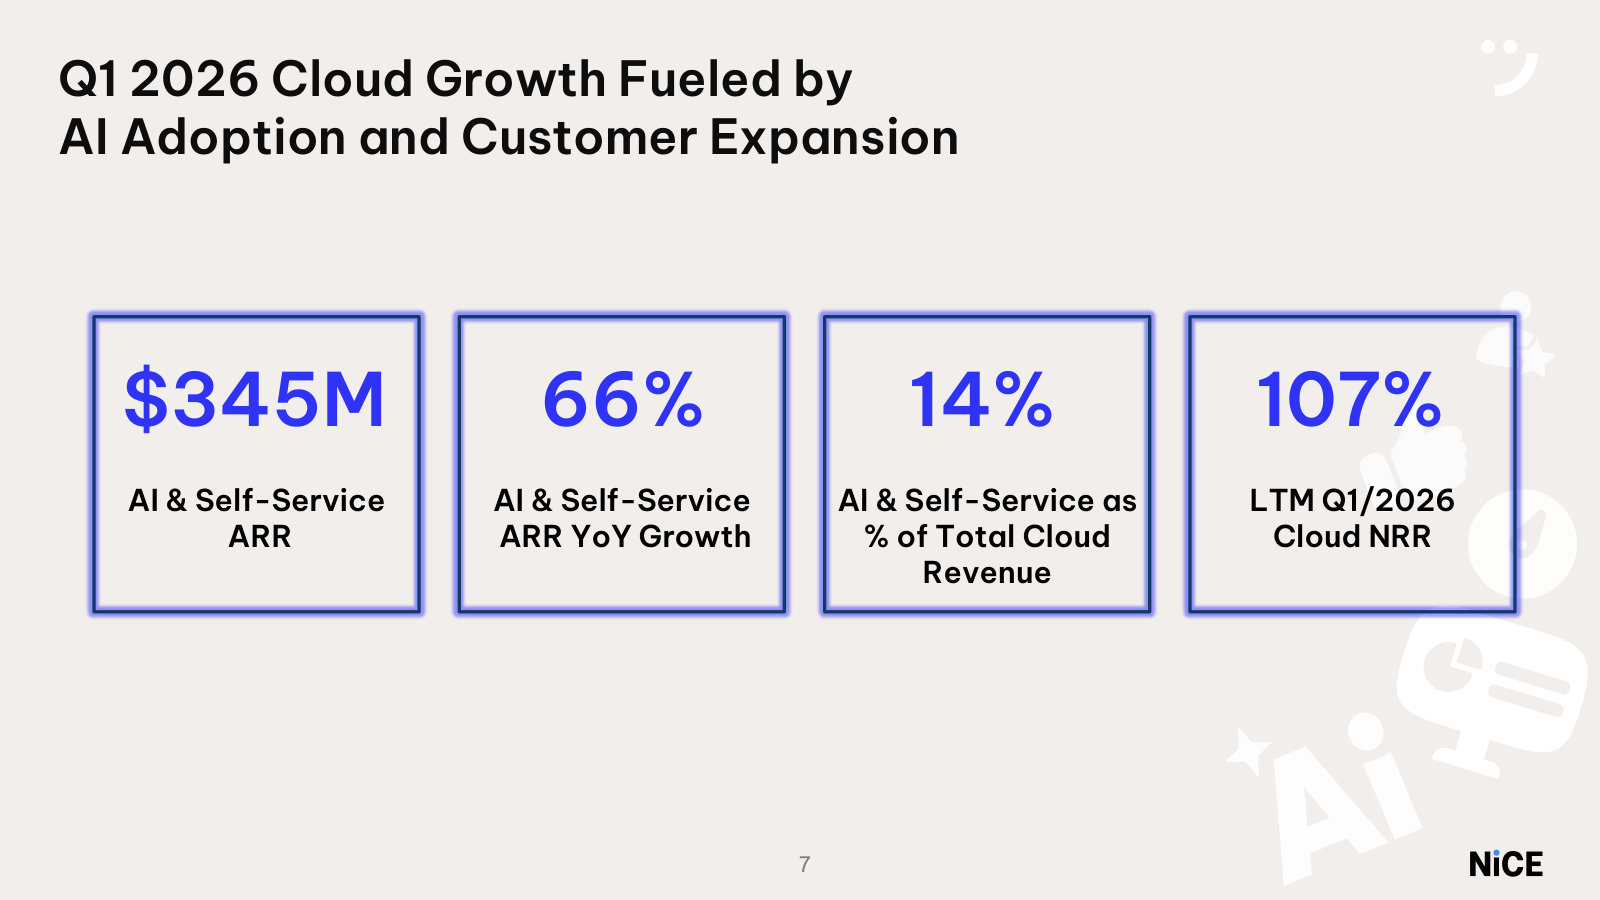
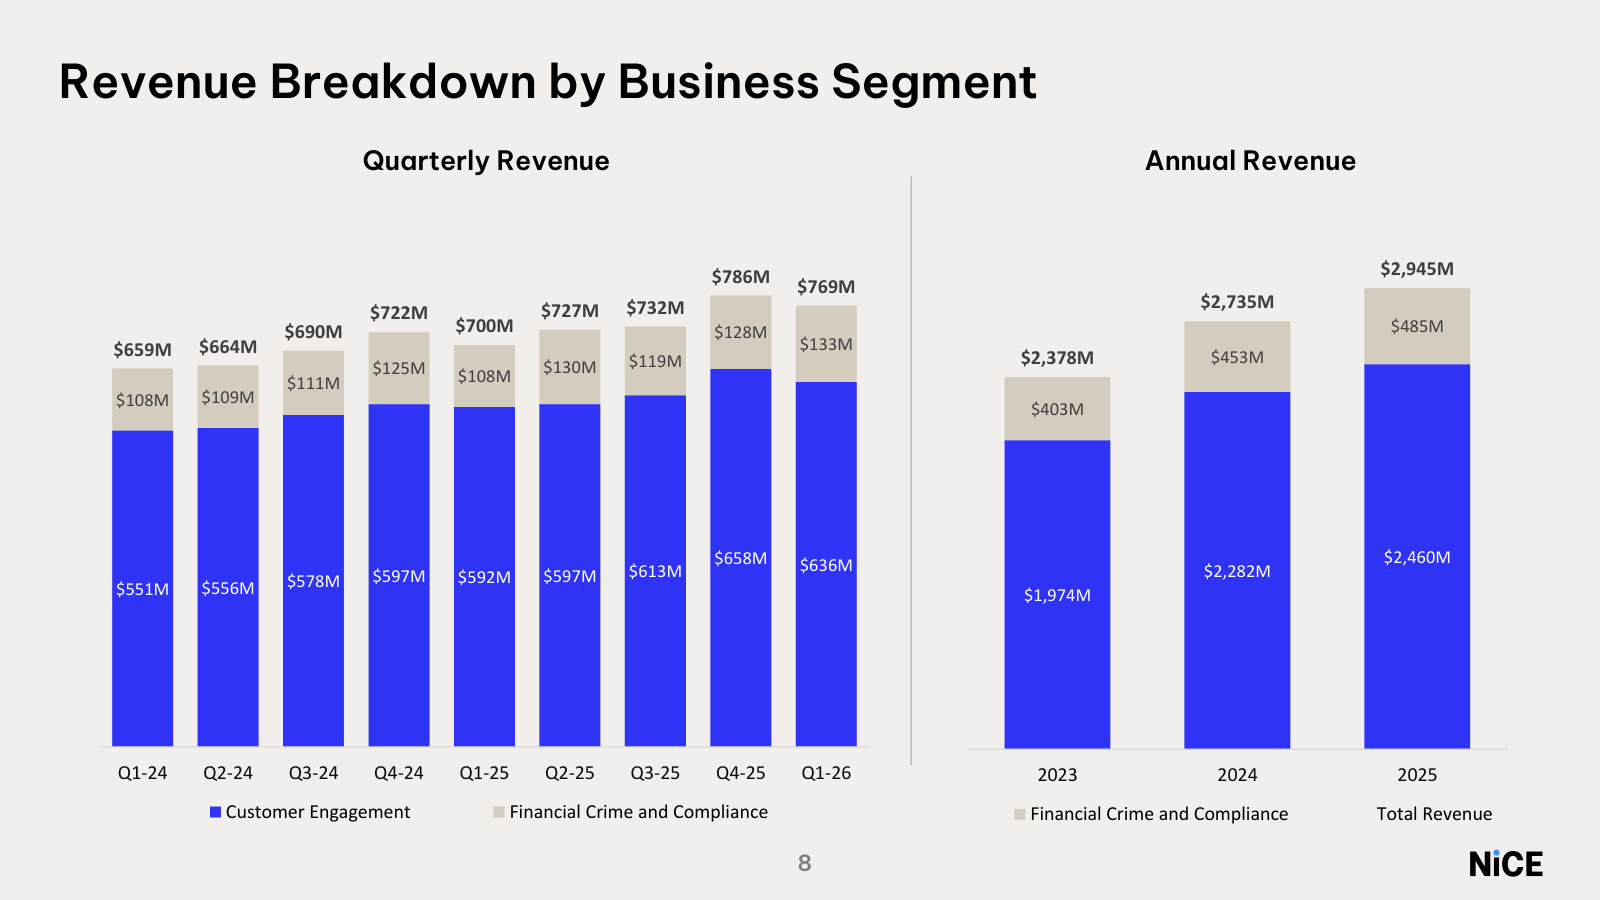
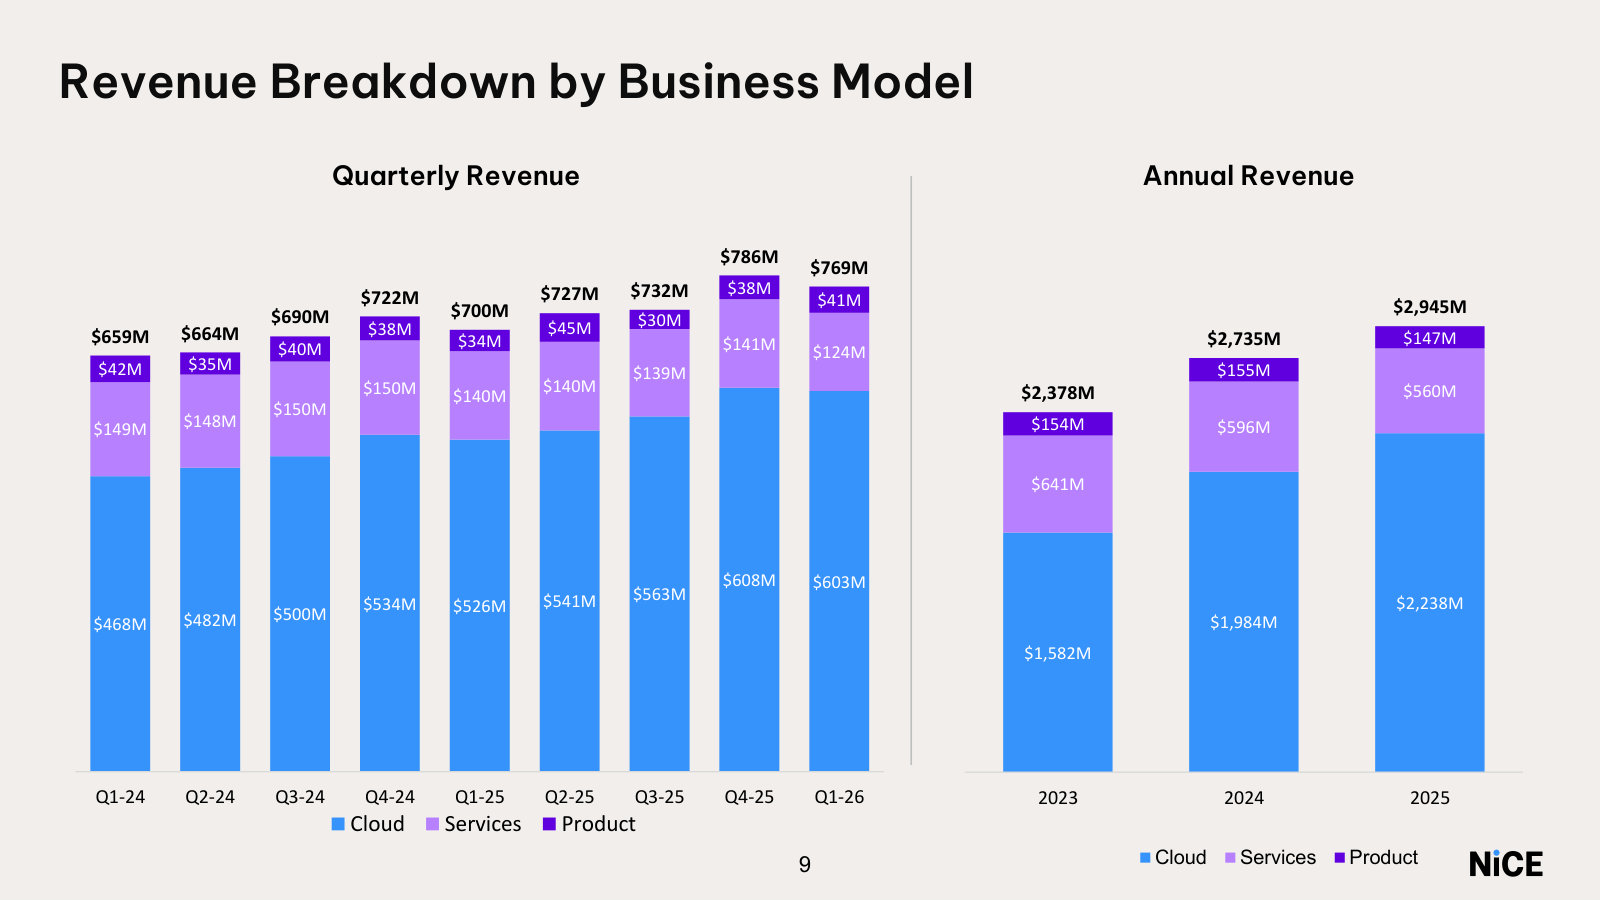
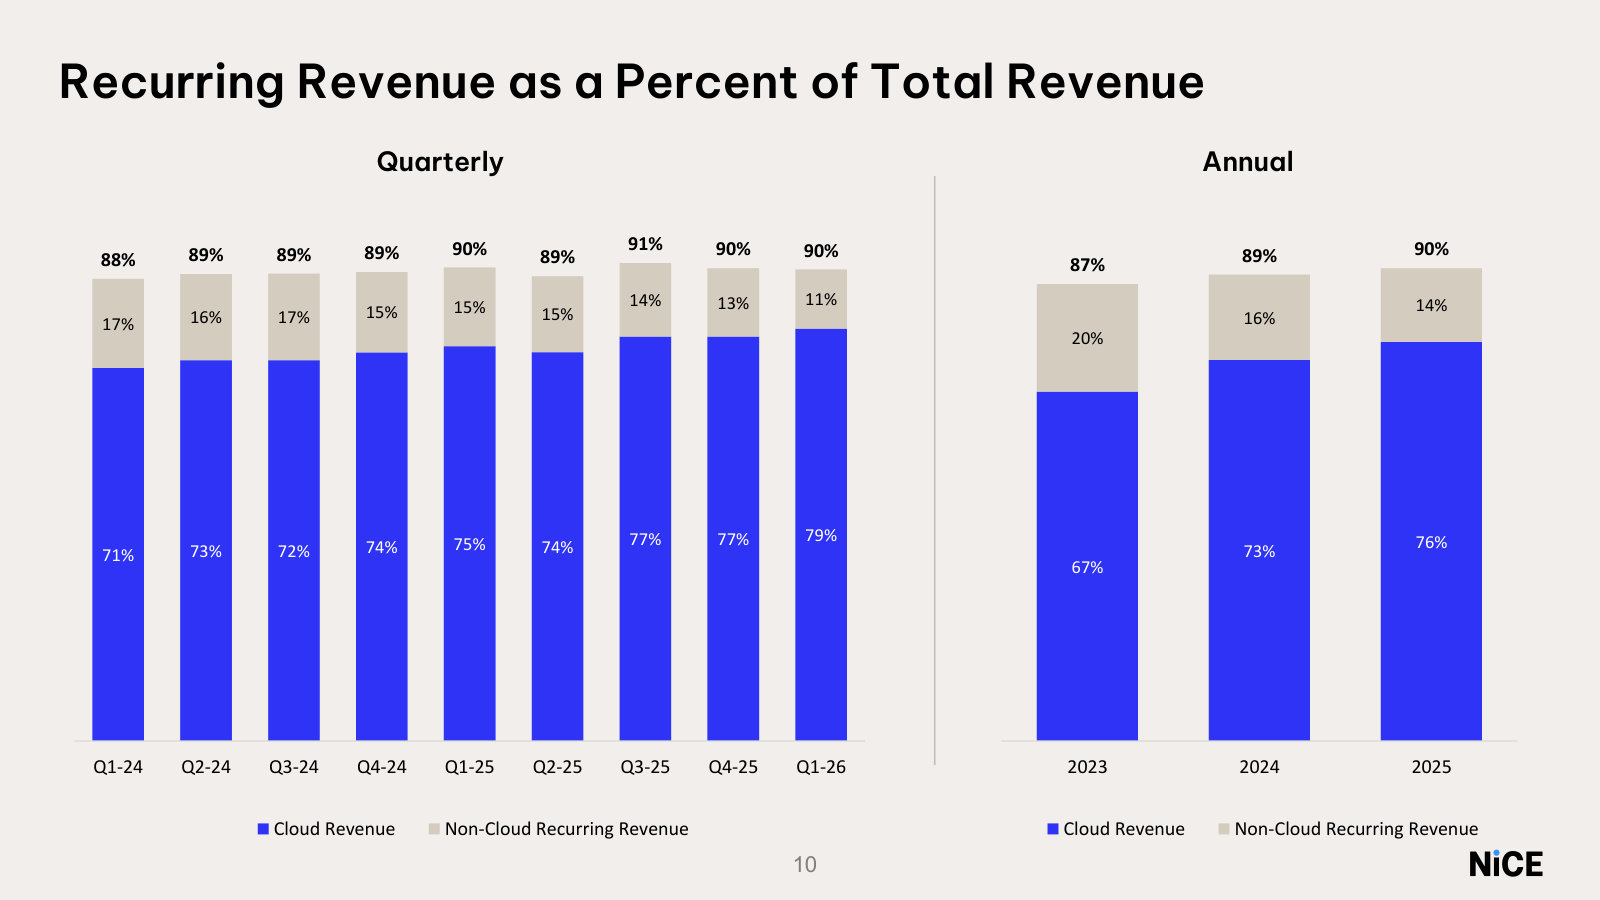
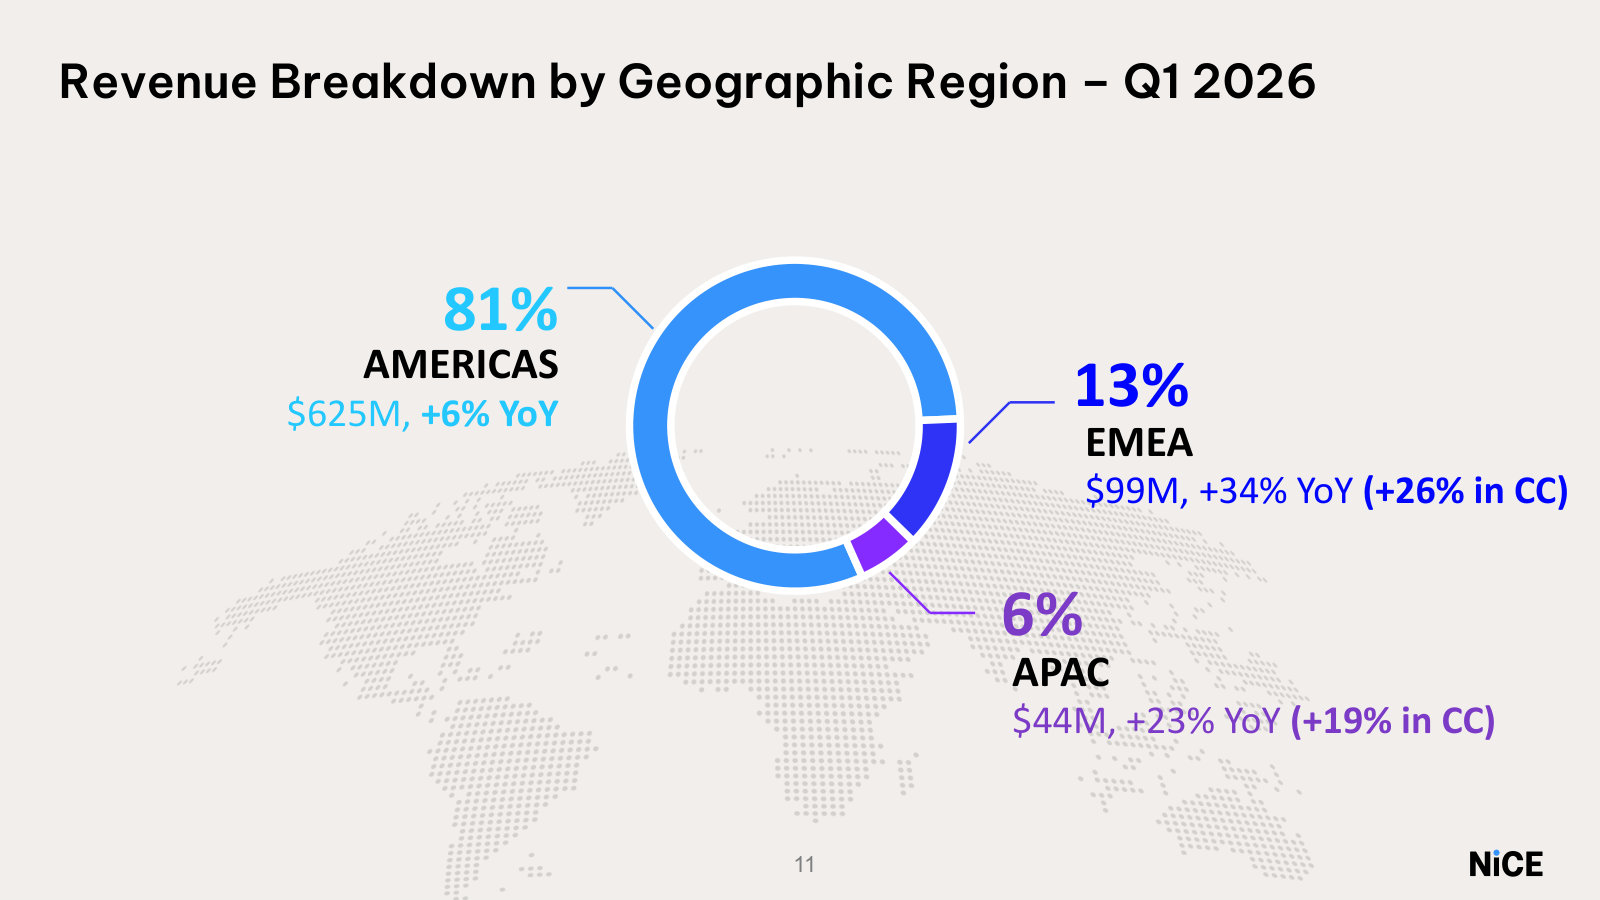
Q1 2026 Earnings Presentation — Q1 2026
The current numbers — segment, business-model and geographic revenue splits with the latest quarterly results. · Open the full document →
More from management
Q4 & Full-Year 2025 Earnings Presentation — Q4 2025 · 28 pages · The full-year 2025 scorecard and initial FY2026 guidance that the strategy targets build on. · Open →
Q4 & Full-Year 2024 Earnings Presentation — Q4 2024 · 29 pages · Full-year 2024 results — the base year for the multi-year growth plan, before Cognigy. · Open →
NICE Ltd.'s management answers for the business every quarter. These are the exchanges that explain it best — verbatim, from the call transcripts preserved in Sources. Each link opens the full transcript at that page in a new tab.
Q1 FY2026 Earnings Call — Q1 FY2026
The AI pivot in full: management is deliberately trading near-term CX revenue for locked-in, long-term AI commitments — and explains why. · Open the full transcript →
How NICE makes money: the 'digital front door' that monetizes every consumer interaction — voice, digital or AI.
Scott Russell (Chief Executive Officer): What's often missed in the discussion around AI is the volume of interactions are rapidly expanding. Today, time is the single biggest constraint limiting how often a consumer engages with a brand. As personal AI removes that friction, IT engagement will further increase and NICE sits directly in the flow of those interactions. We are the digital front door. Most enterprise software companies monetize internal users and some monetize only the AI flows. We monetize all consumer interactions with a brand, be it voice, digital or AI, and that digital front door has no ceiling
p. 21 · Read in context →
Capital allocation: an active, adviser-led exploration to divest the non-CX assets (financial crime, public safety).
Scott Russell (Chief Executive Officer): Before passing it over to Beth, let me briefly address our broader portfolio. We spend a lot of time talking about our CX business, but it's important to remember we also have two other great businesses in financial crime and compliance and public safety, both of which provide mission critical solutions and have strong market positions. As I've shared, we regularly review our portfolio to ensure we are maximizing value for our shareholders. We've been working with advisers over the past several months to run a process for our non CX assets. I want to emphasise that this is an exploration. No decisions have been made and we continue to see value in these businesses
p. 22 · Read in context →
The quarter's core trade, with a worked example: discount legacy products now to lock in a multi-year AI commitment.
Scott Russell (Chief Executive Officer), responding to Sidi Panagarahi (Mizuho): But in that context we're making deliberate commercial decisions to lock in that AI business rather than let it go to a broader market evaluation. This gives us a number of benefits, it shortens the AI sales cycle, it leads to more AI revenues on a faster timeline and it obviously has shown up in our backlog that we've reflected. But what it also then highlights is some near term variability on existing products and timing differences between the AI bookings that convert to revenue. But our view on this is this is the right trade. We are managing the business for long term growth […] There was a customer that came to us that had a large financial services customer where we secured a broader commitment to deploy Cognigy for automation. We added an additional year on the total term and to get the deal done faster, we provided attractive pricing on some of our existing CCX products. The AI deployment will begin contributing to revenue later on in the year and more significantly in 2027, but the discount is felt right away. So as a result there's a near term impact on ARR, but a clear visibility to growth above the pre renewal ARR as the AI bookings convert to revenue
p. 28 · Read in context →
Q4 & Full Year FY2025 Earnings Call — Q4 FY2025
The full-year 2025 scorecard and the clearest rebuttal of the AI-displacement bear case, from the new CEO. · Open the full transcript →
The base business: seats and interactions still growing, with only ~40% of contact centers migrated to cloud — a long runway.
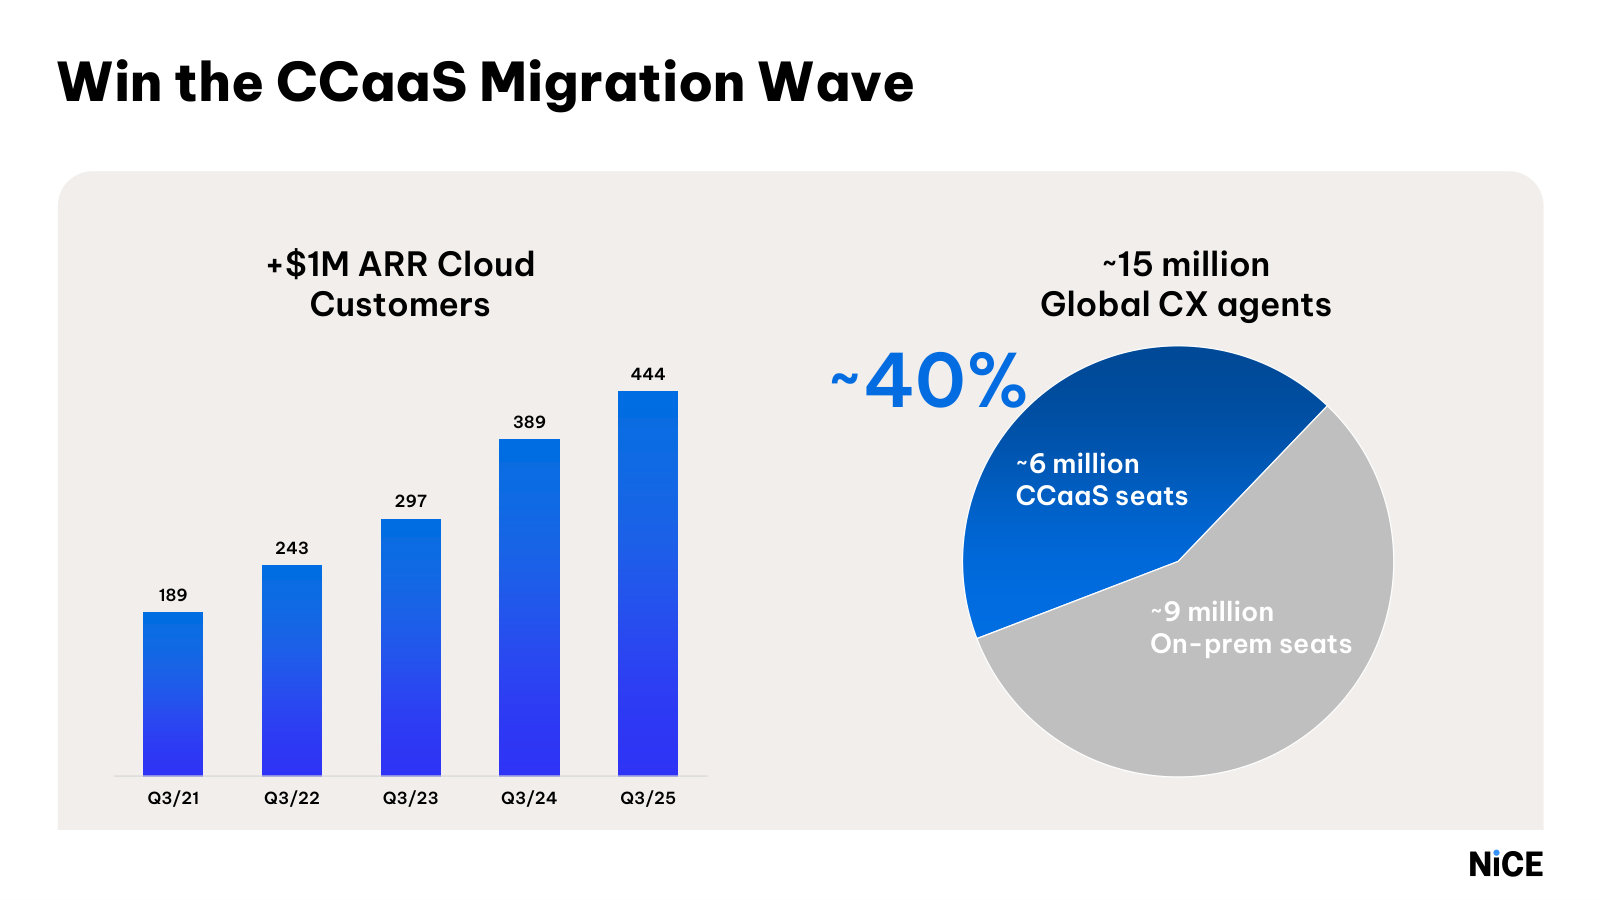
Scott Russell (Chief Executive Officer): None of this would be possible without a healthy core CCaaS business. We have the leading platform in a growing and healthy market. Seats and interactions on CXone continued to grow in 2025. And importantly, only about 40% of contact centers have migrated to CCaaS today, leaving a large and durable on-premise to cloud migration opportunity ahead. We are delivering real transformative value to our customers, and this is translating into strong performance in our core CCaaS business. In Q4, cloud revenue grew 14% year-over-year and excluding NiCE Cognigy, grew 12%.
Q4 was a record quarter for new cloud ACV bookings, including and excluding Cognigy, driving cloud backlog growth to 25%, including Cognigy and 22% excluding it
p. 3 · Read in context →
The bear thesis stated bluntly — 'the market is scared of AI displacing your business' — and management's disconnect argument.
Rishi Jaluria (RBC Capital Markets); Scott Russell (Chief Executive Officer): it’s pretty clear that the market is scared of AI disrupting and displacing your business. Clearly, that’s spread to all of software and is something that we’ve all been dealing with really in a big way over the past couple of months. You made it clear over the past couple of years and at Analyst Day and now today that you’re viewing AI as a real tailwind for NiCE and something that could pick up accelerating momentum in kind of the coming years. Can you maybe help us understand where is the disconnect? Where do you think that the market is wrong […] there is clearly a disconnect between the fears in the market and the reality of what we’re seeing in the business. So let me try to break it down, if I can. First of all, there’s a concern about competition from new AI point coming at the expense of those competitors. Actually, it’s a beneficiary. If you look at NiCE’s business, 13% of our cloud revenue is AI. We’ve already proven that we’ve embedded it into our core platform. We’re able to deliver durable value to our customers
p. 10 · Read in context →
The moat in one answer: NICE rents the frontier models but wraps them in proprietary interaction data and CX specialization.
Scott Russell (Chief Executive Officer): we leverage those models. We have partnerships with those AI players that we can use those models in our stack, but then we’ve built a purposebuilt AI around customer engagement data. And so we differentiate by our specialization. Those models are really powerful, but then we process it on those billions of interactions, the specific learning loops, the optimization. So the specialization around the customer intent resolution, the compliance-heavy workflows, the guardrails that enterprise have, the real-time voice orchestration.
So the reality is it’s not replacing, it’s enabling a more powerful and differentiated outcome
p. 12 · Read in context →
Do advanced-AI customers cut seats? 'No plans to reduce agents' — the data doesn't support seat erosion; growth on both levers.
Arjun Bhatia (William Blair); Scott Russell (Chief Executive Officer): what are you seeing in terms of seat dynamics there […] So rather than elimination of roles, they’re using it as an efficiency driver so their people can be driving more value-added activities. And so they had no plans, no plans to reduce agents in the short to midterm. Now that’s not to say that as we continue to build out our platform that we don’t see the opportunity to be able to reduce the human capacity as the AI picks up. But we — that’s why in these complex environments because remember, CX is tough. you’ve got to have accuracy of data at high volume, the guardrails, the domain expertise and ultimately, it’s got to fulfill a great consumer experience for the brand. And so what they don’t want is a point solution that gives them a bit of automation, but then increases the complexity when it has to interoperate with their AI agents.
And I think we’ve really seized upon this. What we see at the top end is that customers value a unified customer engagement platform. We call it the front door. So whether it’s voice, whether it’s digital, whether it’s AI or what is most likely to be a combination of all three at the same time, real time at enterprises at the top end, they need a platform that can give that in a scalable, reliable way. And obviously, we differentiate on that basis. So it’s interesting about the, I guess, the perceived concerns that you’re going to see this erosion of the seats. We — the data does not support that assertion, but we’re growing on both levers, and we continue to expect to do so
p. 14 · Read in context →
Q4 & Full Year FY2024 Earnings Call — Q4 FY2024
Scott Russell's first call as CEO: the leadership handover, the capital-allocation math, and a candid admission on deployment lag. · Open the full transcript →
The handover on record: Russell's first words as CEO, acknowledging Barak Eilam and framing the AI-leadership claim at 3.5bn interactions.
Scott Russell (Chief Executive Officer): I’m excited to be talking to you today for the first time as CEO of NICE. Before we dive into today’s call, I want to take a moment to acknowledge Barak’s strong leadership that brought NICE to where it is today. It is an honor to lead a company renowned for its relentless innovation, customer centricity and operational excellence. I joined NICE for its undisputed leadership and for its immense potential for growth. With a strong financial foundation, industry leading solutions and 9,000 plus dedicated NICEs all around the world, we are poised to drive NICE into the next era of growth. On today’s call, I want to focus on two key themes. First, NICE is the undisputed AI leader in customer service […] We’re improving customer experiences for hundreds of millions of people worldwide, managing over 3.5 billion AI interactions annually while driving tangible value for our clients, simply put we are leading this market and we are doing so decisively
p. 2 · Read in context →
Capital allocation laid out: 27% free-cash-flow margin, a $500M buyback, $1.2bn net cash — and a plan to repay debt at maturity.
Beth Gaspich (Chief Financial Officer): For the full year 2024, we have generated free cash flow of $733 million, surpassing our free cash flow target of $700 million set out in Q2, yielding an exceptional free cash flow margin of 27%, a level unrivaled in our industry […] In Q4, we repurchased shares totaling $95 million and $369 million for the full year 2024, an increase of 28% year-over-year. We will continue executing our current $500 million share repurchase program throughout this year. Total cash and investments at the end of December totaled $1.622 billion. Our debt stands at $450 million resulting in net cash and investments of $1.2 billion. Our debt matures in mid-September of this year. At this time, our expectation is to repay the debt on maturity. Therefore, we expect less investment income to be generated in the second half of 2025
p. 8 · Read in context →
Guidance philosophy: why the 12% cloud guide is deliberately prudent — no repeat seasonality, slower enterprise ramps, LiveVox drag.
Beth Gaspich (Chief Financial Officer), responding to Meta Marshall (Morgan Stanley): There are several factors that we have taken into consideration as we’ve set this guidance.
I think, first of all, even going into last quarter, we had highlighted that we expected and we were seeing some positive seasonality in the fourth quarter, which played out. But certainly, seasonality is not something that you can always be confident around and so we have taken that into consideration and have not assumed that we will have the same level of seasonality in the back half of this year given that it’s still early in the year. The second thing that I would call out and that Scott also highlighted in his remarks earlier today, is that we do know that we are seeing more and more large enterprise deals, and these deals are taking us longer to deploy. In the fourth quarter, we actually saw an improvement in the deployment time. But of course, it’s something that we’re continuing to be focused on and need to be confident that that will be a recurring event […] we’ve known that the LiveVox growth rate does come with a bit of headwind. And of course, we are – have that factored into the guidance as well. So, I would say all of those are a combination of things that were considered as we thought about the guidance of the 12% on cloud for this year
p. 10 · Read in context →
The bear case met head-on: yes, fewer human agents over time — but a unified voice-plus-AI platform is the durable position.
Scott Russell (Chief Executive Officer), responding to Arjun Bhatia (William Blair): I do believe firmly that we will see over time a reduction in human agents, an increase of AI agents. But the combination and the interactability is going to be the key. Rather than you go to one channel or the other, you need to have a unified platform to be able to fulfill a consumer who frankly doesn’t really care about how who they interact
p. 21 · Read in context →
Q3 FY2024 Earnings Call — Q3 FY2024
Barak Eilam's farewell call — the transition announcement and his sharpest defense of NICE against the AI-cannibalization fear. · Open the full transcript →
The thesis in one image: inverting the 90%-human/10%-tech cost mix, with billions of proprietary interactions as the barrier.
Barak Eilam (Chief Executive Officer): Historically, the customer service equation had been heavily skewed with 90% reliance on human resources and nearly 10% on technological solutions. Today, we possess the tools to invert this equation, bringing us closer than ever to fully automated customer service that meets both precision and scale. Nevertheless, the journey towards authentic automation and customer service is through its challenges, with significant barriers to domain expertise, only those vendors fortified with deep resources and robust foundation in customer service, including agents, workloads and knowledge will successfully make this leap. At NICE, we possess all of that in an unrivaled advantage. IMEC CRM and generic big tech, we manage billions of customer service interactions every year, providing us exclusive untethered access to customer intent at any given time, the most important ingredient for customer service automation
p. 3 · Read in context →
The succession, announced: Eilam's last call, with Scott Russell taking over January 1 and a continuity message.
Barak Eilam (Chief Executive Officer): as this will be my last earnings call, I want to express my gratitude to each of you for the trust and support you have shown me over the years. Leading this company has been one of the greatest honors of my life. Together with 9,000 NICErs, we have built NICE into a multibillion dollar global category leader. I have soul confidence in NICE’s continued leadership due to the strengths of our team, the resilience of our vision and the many opportunities ahead.
I will continue to drive the company through the end of the year and ensure a smooth transition to Scott Russell, who will assume the CEO position on January 1st
p. 7 · Read in context →
Why AI isn't a like-for-like cloud swap: it re-engineers workflows and removes agents — slower to land, but permanent.
Barak Eilam (Chief Executive Officer), responding to Rishi Jaluria (RBC Capital Markets): the market of customer service automation is not — it’s not just about the move from on-prem to cloud, that’s the easy part, if you would like.
It is about, as I said before, reengineering workflows, taking out agents from the workflows and embedding AI instead. So that’s from customers take a bit longer. But when it happens, it happens in a massive scale and it’s going to be there forever, because it’s going to replace before, a significant backlog that we have for CXone. With that change of mix, it gives us optimism about the future
p. 13 · Read in context →
Q3 FY2023 Earnings Call — Q3 FY2023
Where NICE first laid out its generative-AI-for-CX playbook — the origin of the whole thesis, well before the CEO transition. · Open the full transcript →
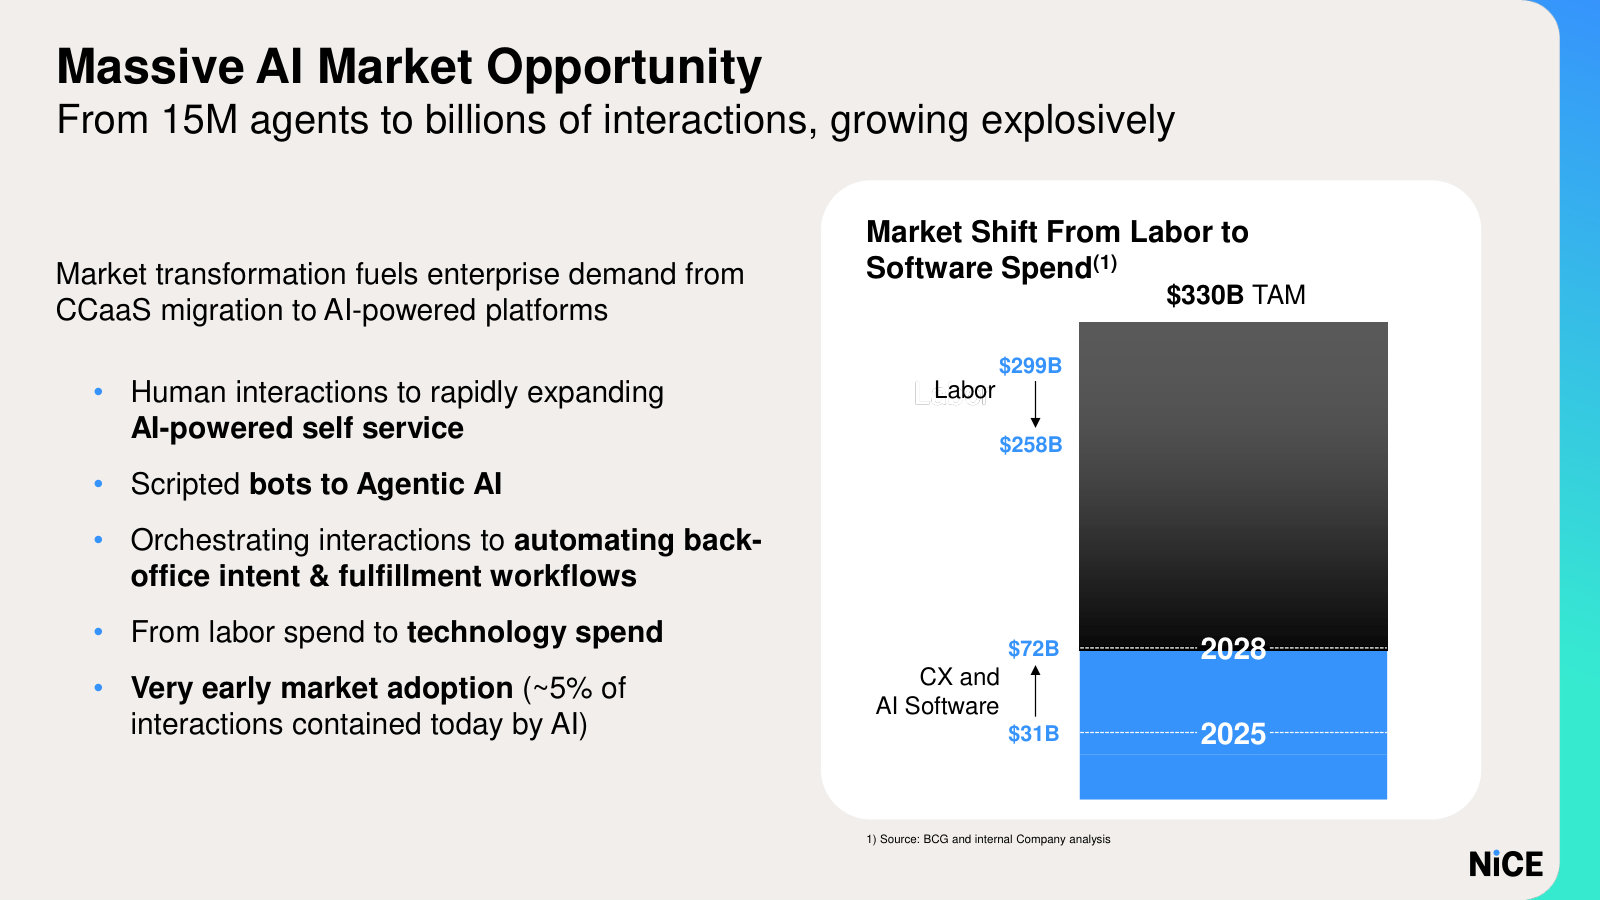
AI reframed as an incremental TAM and a tailwind that pulls forward cloud migration in a market only 20% penetrated.
Barak Eilam (Chief Executive Officer): AI is now a meaningful growth engine by itself with a significant incremental TAM.
This powerful growth engine is substantiated by the fact that in Q3, AI was included in 80% of our new enterprise CX deals and was the fuel that drove those deals. Additionally, year to date our CXone AI bookings increased 163% and digital engagement bookings grew 78% compared to the same period last year. The CX market is experiencing a shift in demand dynamics that is a tailwind for NICE. This favorable shift is unleashing a positive ripple effect. It starts with heightened demand for CX AI. This in turn is driving an accelerated demand for platformization because for AI to be effective in the complex world of CX, there is a resolute prerequisite to converge all CX assets into a single platform. This mandates faster decision making for cloud adoption and migration in a market that is still only 20% penetrated in the cloud
p. 3 · Read in context →
How AI monetizes, concretely: deals where AI doubled or 6x'd ACV and beat rivals who 'could only deliver slideware.'
Barak Eilam (Chief Executive Officer): In a seven-digit ACV deal with one of the largest cruise ship operators, digital engagement and CX AI doubled the size of the deal. AI was the main determining factor for our win over multiple competitors that could only deliver slideware. In another seven-digit ACV deal, this one with a large BPO, AI increased the deal by 6x.
This company, like many other BPOs, is expanding its AI capabilities to transform their business model by using more automation. The incumbent cloud provider which we replaced could not deliver true CX AI capabilities. We signed a seven-digit ACV deal with a major European broadband provider, and this deal was 100% AI
p. 4 · Read in context →
The product model explained: Copilot and Autopilot as a continuum, and why a unified platform breaks 20 years of automation failures.
Meta Marshall (Morgan Stanley); Barak Eilam (Chief Executive Officer): most vendors and companies talk about automation, it’s either/or. It’s either you have something with an agent that is fully manual, done by the agent with some technology, or fully automated tasks. The approach we have been taking with AI, and that’s the reason that we have launched Copilot and Autopilot together, the Enlighten Copilot and Autopilot, is the ability to move in this continuum and deliver a continuous experience for customers […] The ability with CXone, that is a unified platform that has all the convergence assets and provides AI for both agents and for full automation, that’s what allows you to break this 20-some years of failures in automation and bring it to life
p. 15 · Read in context →
Competitive dynamics named: why NICE out-wins Genesys — incumbent lock-in, a debt-laden rival, and the digital/AI investment gap.
Pat Walravens (JMP Securities); Barak Eilam (Chief Executive Officer): If you look at the Gartner magic quadrant, you and Genesis are the two clear leaders in the space. Can you walk us through what the competitive dynamics are like with them? When do you usually win and when you do usually not win? How does it work […] We have a superior winning rate over Genesis. In many cases Genesis and others are the incumbents, and they are, because of their financial considerations, trying to hold onto their customer base and maintenance base. That’s number one. Second, I think given once again the financial considerations, like very high debt and the way that the company is being held in terms of ownership, I think they are very short term oriented in terms of their investment in the long term viability of the company for customers. I think that gives us superiority. Our investments specifically in expanding into digital engagement and AI is something that we haven’t seen there, and it gives us these days a significant advantage
p. 16 · Read in context →
The cannibalization fear, first posed: AI lets firms avoid adding labor rather than cut agents — with 20% cloud penetration still to run.
Michael Funk (Bank of America); Barak Eilam (Chief Executive Officer): we don’t see right now, whether it’s good or bad, we don’t see a reduction in [indiscernible] agent industry right now, not to speak about the fact that with 20% penetration of cloud, even if there will be some reduction in number of agents, we still have a very, very long way to go in winning market share on the agents. What we see is that a lot of companies are dealing–it’s almost like avoiding adding more labor because the number of interactions, digital or not, are increasing exponentially and becoming more complicated, and that’s where they are trying to deploy AI in order to avoid the additional labor costs
p. 17 · Read in context →
More calls
Q2 FY2025 Earnings Call — Q2 FY2025 · 30 pages · Go here for the Cognigy acquisition rationale — NICE's move into agentic AI and the CXone Mpower build-out under Scott Russell's first full year. · Open →
Q1 FY2025 Earnings Call — Q1 FY2025 · 32 pages · Russell's first full quarter as CEO: the early read on his priorities and the CXone Mpower ramp before the Cognigy deal. · Open →
Q2 FY2024 Earnings Call — Q2 FY2024 · 30 pages · Barak Eilam's mid-2024 platform update on CXone Mpower — the AI story at full stride the quarter before the succession was announced. · Open →
Q1 FY2024 Earnings Call — Q1 FY2024 · 27 pages · The start of the AI-bookings acceleration year, with Eilam quantifying how AI was attaching to and enlarging enterprise CX deals. · Open →
Q4 & Full Year FY2023 Earnings Call — Q4 FY2023 · 33 pages · The FY2023 annual: the full-year framing of the CXone platform and Enlighten AI strategy that the Q3 2023 call introduced. · Open →
Q2 FY2021 Earnings Call — Q2 FY2021 · 30 pages · The pre-AI baseline: the pandemic-era CXone cloud-migration story that defined NICE's growth before generative AI reframed it. · Open →
NICE Ltd.'s annual reports contain management's most considered account of the business. These are the sections, passages and visual pages worth opening in the originals preserved in Sources.
NICE Ltd. — FY2025 Annual Report (Form 20-F) — FY2025
The latest 20-F: management's full account of the two-segment AI software business, its economics, and what drove 2025 results. · Open the full document →
Item 3. Key Information — Risk Factors — p. 9 · Read the full section →
The risks specific to NICE: whether its own AI cannibalizes the seat-based pricing and voice franchise that still fund the business.
Management flags that AI adoption may shift revenue off per-seat pricing — a risk to its own model.
Additionally, market acceptance of AI-based products and services may accelerate certain trends in the markets in which we operate. For example, a shift from seat-based recurring revenue to consumption-based revenue, or decrease in demand for solutions priced based on the number of human agents deployed. If we are not able to successfully address the effect of such AI-related trends on our business models, our business, financial condition and results of operation may be adversely affected
p. 11 · Read in context →
The shift away from voice — including to autonomous AI agents — threatens solutions that still generate significant revenue.
The trend of enterprise customers moving from voice communications to other means of communication with the enterprise (such as autonomous AI agents, self-service, e-mail, messaging applications, social media and chat) may result in a reduction in the demand for our voice platform and applications.
p. 12 · Read in context →
Item 4.B Business Overview — p. 33 · Read the full section →
The business in management's words — two markets, an AI-first thesis, a new CEO, and the Cognigy deal anchoring the Agentic-AI pivot.
How NICE frames itself: AI-powered cloud platforms across Customer Engagement and Financial Crime & Compliance.
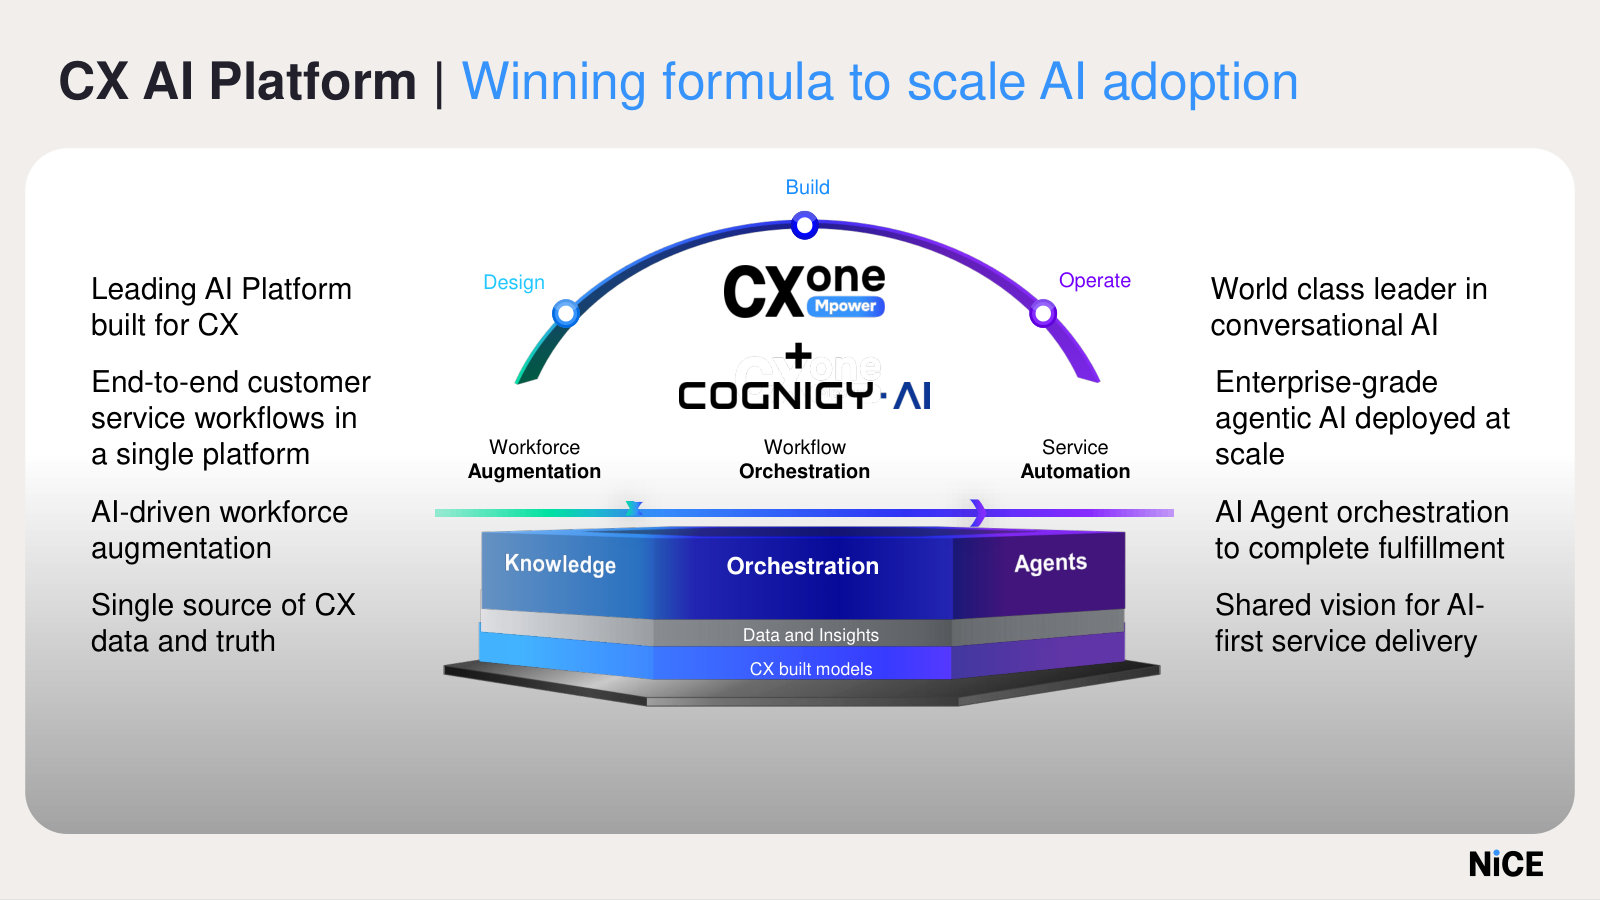
NiCE is a global enterprise software leader, delivering mission-critical AI-powered cloud platforms that serve two main markets: Customer Engagement and Financial Crime and Compliance. Our platforms are designed to automate complex, high-volume, and highly regulated workflows where reliability, security, and measurable outcomes are essential. In Customer Engagement, our CXone platform enables enterprises to automate customer service by orchestrating workflows, AI, and human agents, and enterprise knowledge within a single, unified AI platform. In Financial Crime and Compliance, we provide embedded AI solutions that help financial institutions prevent money laundering and fraud, and ensure real-time regulatory compliance across financial markets.
p. 33 · Read in context →
The strategy reset: domain-specific AI, a January 2025 CEO change, and the September 2025 Cognigy deal.
Our long-term strategy is to further broaden our industry leadership in both the Customer Engagement and Financial Crime and Compliance market segments using our unique domain-specific AI capabilities and our foundational platforms, applications and data assets. In January 2025, we completed a leadership transition with Scott Russell assuming the role of CEO, bringing deep enterprise software and cloud experience to accelerate our AI‑first platform strategy. […] In September 2025, we acquired Cognigy, a global leader in conversational and Agentic AI.
p. 38 · Read in context →
Item 5. Operating and Financial Review and Prospects — p. 55 · Read the full section →
Where management explains the numbers: the cloud/services/product mix shift and what actually drove 2025 revenue in each segment.
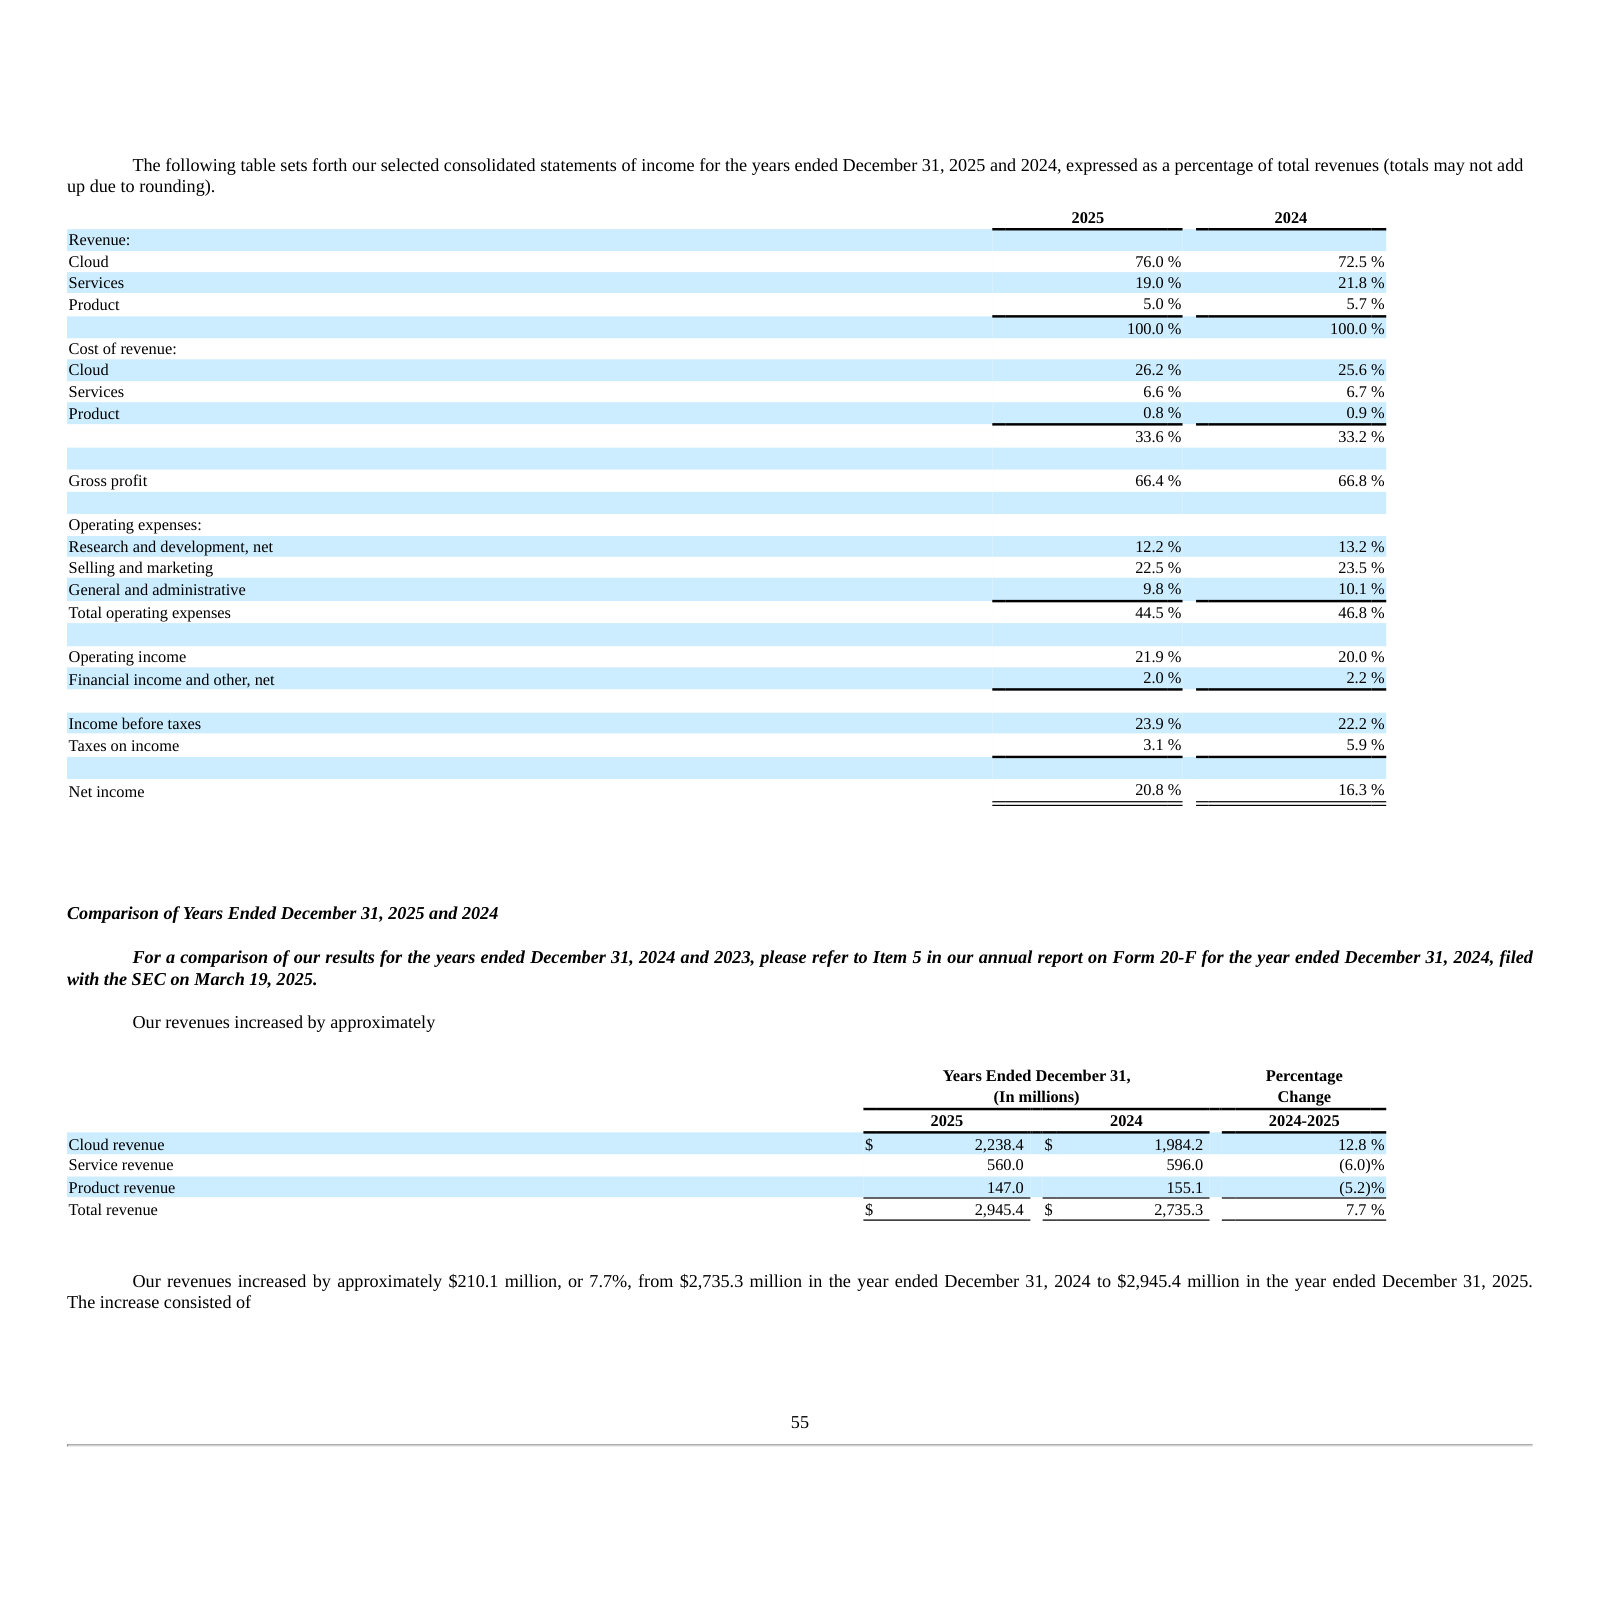
The drivers by segment: CXone demand and large-enterprise penetration in CX; X-Sight/Xceed adoption in Financial Crime.
The revenue growth of our Customer Engagement business segment in 2025 is primarily attributed to the continued increase in demand for our cloud platform CXone from new customers and ongoing expansion within our installed customer base, driven by further penetration into the large enterprise market globally. […] The revenue increase in our Financial Crime and Compliance business segment in 2025 is primarily attributed to an increase in cloud revenue due to increased adoption of our cloud platforms X-Sight and Xceed, as well as an increase in revenues from our premise-based business.
p. 63 · Read in context →
Note 16. Reportable Segments and Geographical Information — p. 169 · Read the full section →
The segment economics laid bare: Customer Engagement dwarfs Financial Crime & Compliance in revenue, but both post strong operating margins.
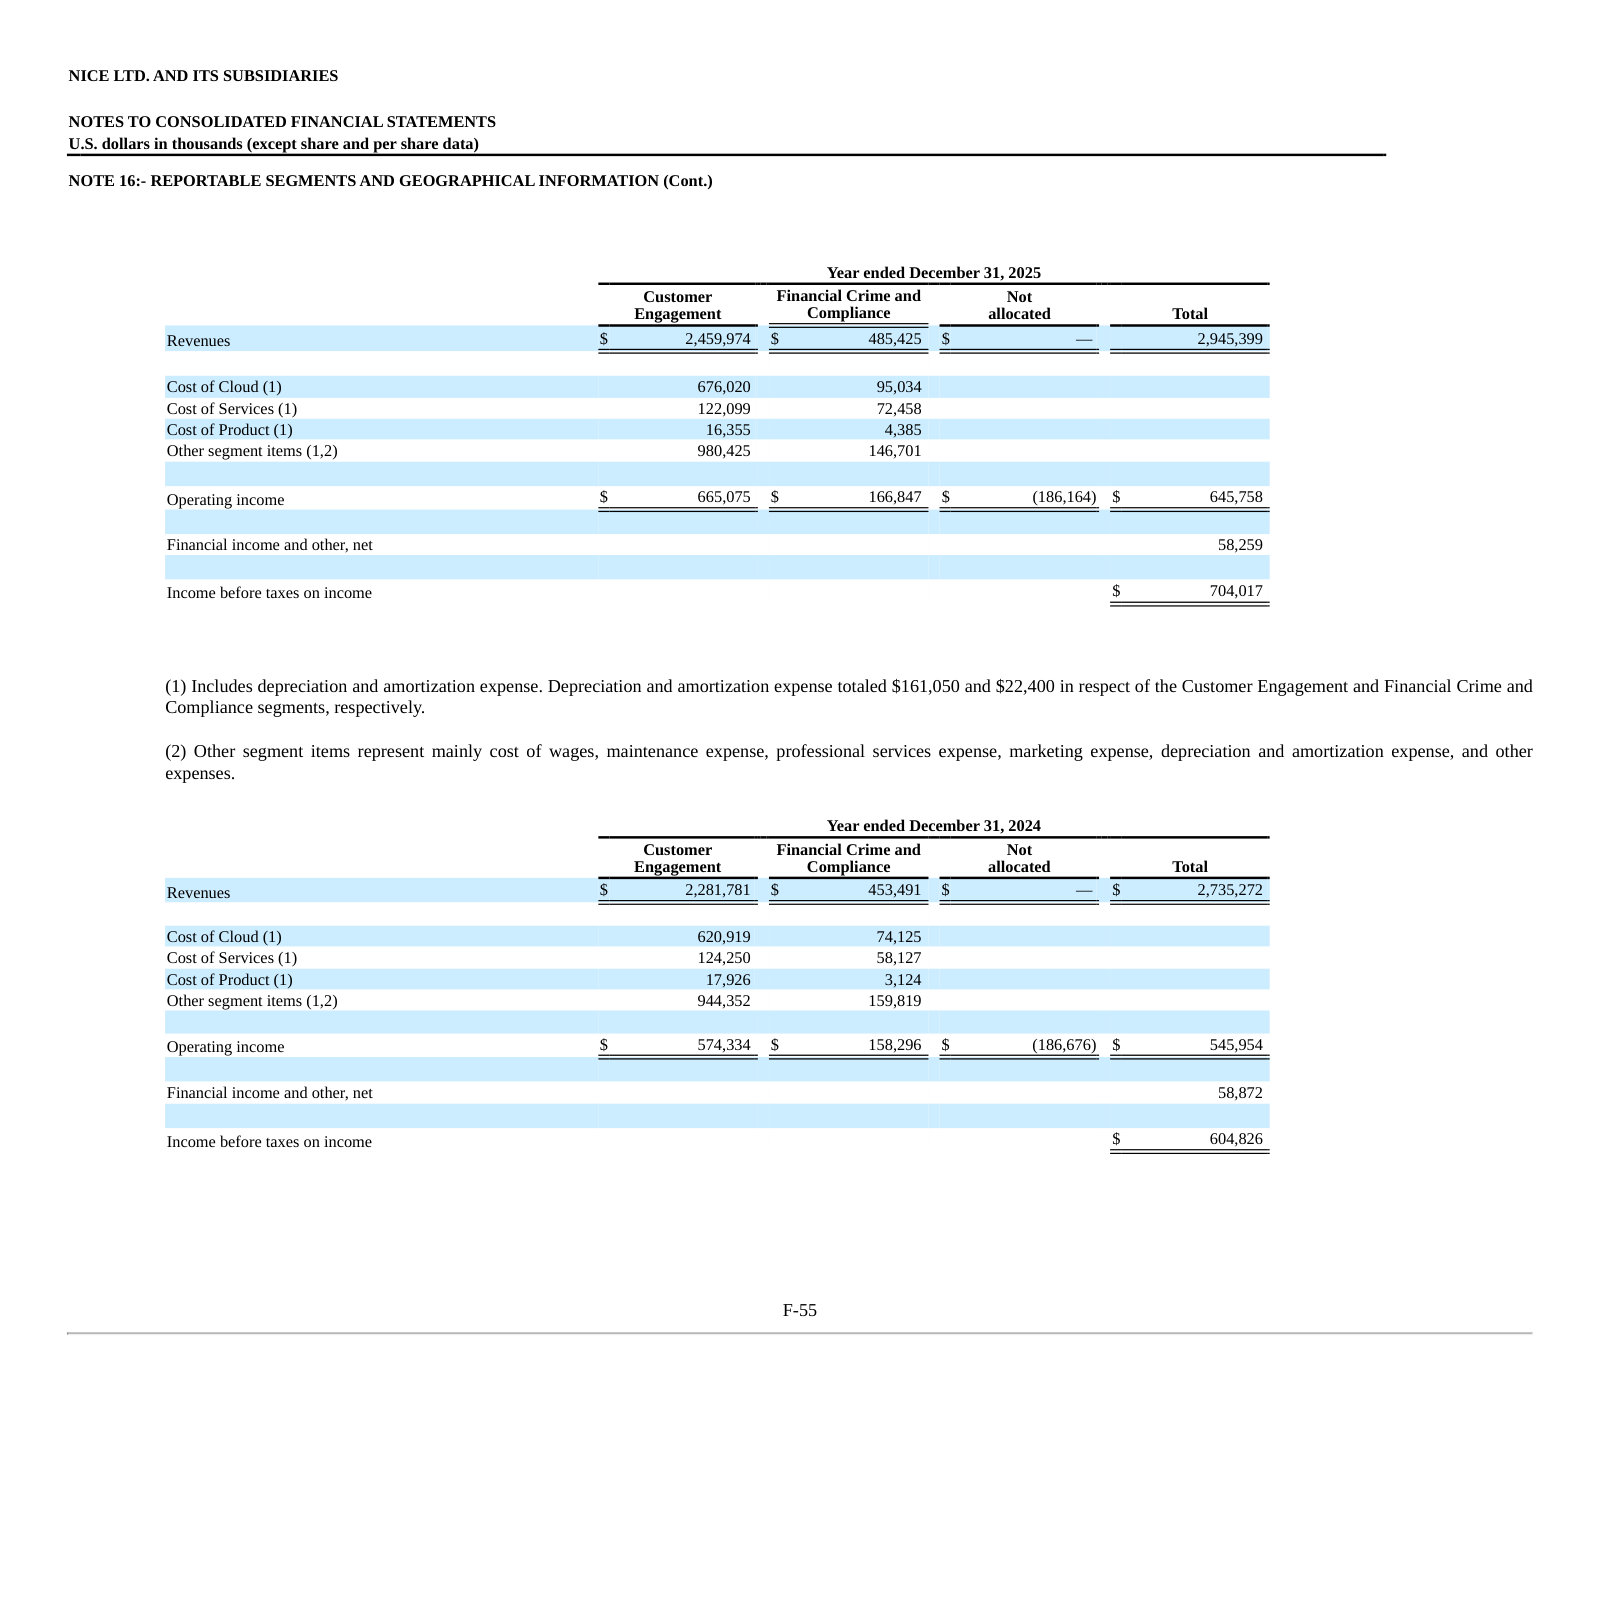
NICE Ltd. — FY2021 Annual Report (Form 20-F) — FY2021
The pre-pivot edition: the same section four years earlier reads 'digital-first' and 'digital powerhouse,' not AI-first — a clean before-and-after on strategy. · Open the full document →
Item 4.B Business Overview — p. 45 · Read the full section →
Read against FY2025, it shows the thesis moving from digital transformation and cloud migration to an AI-first, Agentic mandate.
FY2021 framing: 'cloud platforms for AI-driven digital business solutions' and a 'digital-first consumer reality.'
NICE is a global enterprise software leader, providing cloud platforms for AI-driven digital business solutions that serve two main markets: Customer Engagement and Financial Crime and Compliance. Our core mission is to transform experiences to be extraordinary and trusted, and create frictionless and safe digital-first consumer reality, where every interaction is easy, effortless and instantaneous. Our solutions are used by organizations of all sizes and are offered in multiple delivery models, including cloud and onpremises.
p. 45 · Read in context →
The FY2021 ambition was to become 'a true digital powerhouse' — no mention of Agentic or domain-specific AI.
Our long-term strategy is to further establish our status as an industry leader in both the Customer Engagement and Financial Crime and Compliance market segments. In Customer Engagement, we will continue to leverage CXone, as well as our large customer base, to continue our leadership in the CX market. We will continue to expand our digital reach through a series of strategic productlaunches, fueled by organic developments and acquisitions, whereby we intend to become a true digital powerhouse.
p. 53 · Read in context →
More annual reports
NICE Ltd. — 2024 Annual Report — FY2024 · 186 pages · The glossy FY2024 edition; the last full year under prior CEO Barak Eilam before the AI-first reset. · Open →
NICE Ltd. — FY2023 Annual Report (Form 20-F) — FY2023 · 160 pages · FY2023 Form 20-F — the detailed filing midway between the FY2021 and FY2025 strategy statements. · Open →
NICE Ltd. — 2022 Annual Report — FY2022 · 206 pages · The glossy FY2022 edition, covering the first full year of the CXone-led cloud acceleration. · Open →
Source: S&P Capital IQ transcripts via Xpressfeed · latest indexed call 2026-05-06 · generated 2026-07-23.
Latest call digest
NICE Ltd., Q1 2026 Earnings Call, May 06, 2026 · 2026-05-06T12:30:00
Q1 2026 (reported May 6, 2026). The prepared remarks read as a clean beat: total revenue of $769 million and non-GAAP EPS of $2.64 both cleared the high end of guidance, cloud grew 14.6% year-over-year, AI ARR rose 66% to 14% of cloud revenue, international grew 30%, and management called it a record first quarter for new cloud ACV bookings. The Q&A told a more complicated story. Almost every analyst returned to one point: why full-year cloud-growth guidance was widened to 13%–15% (from 14.5%–15% a quarter earlier) and why Q2 cloud growth is now guided slightly below the full-year range. Management's explanation was consistent — in Q1 it took "renewal-specific commercial actions" with a small number of marquee customers, discounting existing CX products (call recording was the named example) in exchange for locked-in, multi-year AI commitments. The near-term effect is discounting felt immediately and NRR down to 107%, with AI revenue converting from backlog later in 2026 and into 2027. Scott Russell repeatedly reframed this as "playing offense," not a response to buyer pressure. Two other items stood out: management disclosed an exploratory process, run with advisers, to divest the non-CX assets (financial crime and compliance, public safety), and it flagged a step-up in R&D and go-to-market investment. Stated guidance: FY26 revenue reiterated at $3.170B–$3.190B, EPS raised to $10.98–$11.18, Q2 revenue $761M–$771M (about 5.5% growth) and Q2 EPS $2.60–$2.70; free cash flow margin now expected at the higher end of the 18%–19% range.
Participant coverage from the latest call.
| Group | Participants | Count |
|---|---|---|
| Management | Operator; Ryan Gilligan — Vice President of Investor Relations, NICE Ltd.; Scott Russell — Chief Executive Officer, NICE Ltd.; Beth Gaspich — Chief Financial Officer, NICE Ltd. | 4 |
| Analysts | Kincaid LaCorte — Analyst, Citizens JMP Securities, LLC, Research Division; Sitikantha Panigrahi — Managing Director, Mizuho Securities USA LLC, Research Division; Samad Samana — Equity Analyst, Jefferies LLC, Research Division; Arjun Bhatia — Partner, Co-Group Head of the Technology, Media, and Communications Sector & Analyst, William Blair & Company L.L.C., Research Division; Rishi Jaluria — MD & Information Technology Equity Research Analyst, RBC Capital Markets, Research Division; James Reynolds — Research Associate, Morgan Stanley, Research Division; James Fish — MD & Senior Research Analyst, Piper Sandler & Co., Research Division; Thomas Blakey — Research Analyst, Cantor Fitzgerald & Co., Research Division; Michael Funk — VP in Equity Research, BofA Securities, Research Division | 9 |
Curated latest-call exchanges; one row per analyst topic.
| Analyst | Firm | Topic | What changed in Q&A |
|---|---|---|---|
| Kincaid LaCorte | Citizens JMP Securities | AI competition (Sierra's $950M raise) | Russell framed the raise as validation of a large CX AI market and argued point solutions cannot match an enterprise-grade platform for complex, regulated interactions. |
| Sitikantha Panigrahi | Mizuho Securities | Q2 cloud step-down and widened full-year cloud guide | Management attributed the step-down to the marquee-customer renewal actions and reaffirmed roughly 200 bps of Cognigy contribution for the year. |
| Samad Samana | Jefferies | Whether the deflationary renewal effect was contemplated in prior guidance | One of the hardest exchanges; Gaspich acknowledged the action was not contemplated when guidance was set last quarter, and Russell insisted it was proactive offense rather than defending contracts. |
| Arjun Bhatia | William Blair | Portfolio review of financial crime and public safety; trading near-term CX for future AI | Russell kept the divestiture process strictly exploratory with no decisions made, and characterized the renewal trade as short-term give for long-term AI lock-in. |
| Rishi Jaluria | RBC Capital Markets | AI backlog-to-revenue timeline and consumption visibility | Gaspich and Russell described a commitment-first model where signed minimums enter revenue and consumption layers on top, with deployment work delaying recognition. |
| James Reynolds | Morgan Stanley | Durability of international growth | Russell and Gaspich called international a durable driver, citing international cloud revenue growing over 50% on a constant-currency basis off an underpenetrated base. |
| James Fish | Piper Sandler | Product stabilization, term renewals, and why take the pricing action now | Another pointed exchange; Gaspich tied term renewals to the financial crime business and ~90% recurring, while Russell reframed the pricing move as decisive advantage-taking, not need. |
| Thomas Blakey | Cantor Fitzgerald | Automated Insights monetization and setup for 2027 | Gaspich pointed to budget being spent now and Russell to a quantified-ROI, production-grade agent workflow built on NICE's data. |
| Michael Funk | BofA Securities | Which CX components are under pressure and whether power shifted to buyers | The most skeptical line of questioning; Russell said only a very small share of products face compression and denied a buyer-power shift, calling call recording a healthy product used as an example. |
Theme tracker
Themes are curator-classified across supplied calls.
| Theme | Status | Quarters mentioned | Read-through |
|---|---|---|---|
| AI monetization and the AI-first pivot | persisted | Q2 2023, Q3 2023, Q4 2023, Q1 2024, Q2 2024, Q3 2024, Q4 2024, Q1 2025, Q2 2025, Q3 2025, Q4 2025, Q1 2026 | The single continuous thread. Enlighten/Copilot/Autopilot framing under Eilam gave way to a disclosed CX AI and self-service ARR metric from Q1 2025 ($200M+, +39%) that reached $345 million and 14% of cloud revenue by Q1 2026. The narrative is durable; the debate has moved from adoption to monetization and pricing model. |
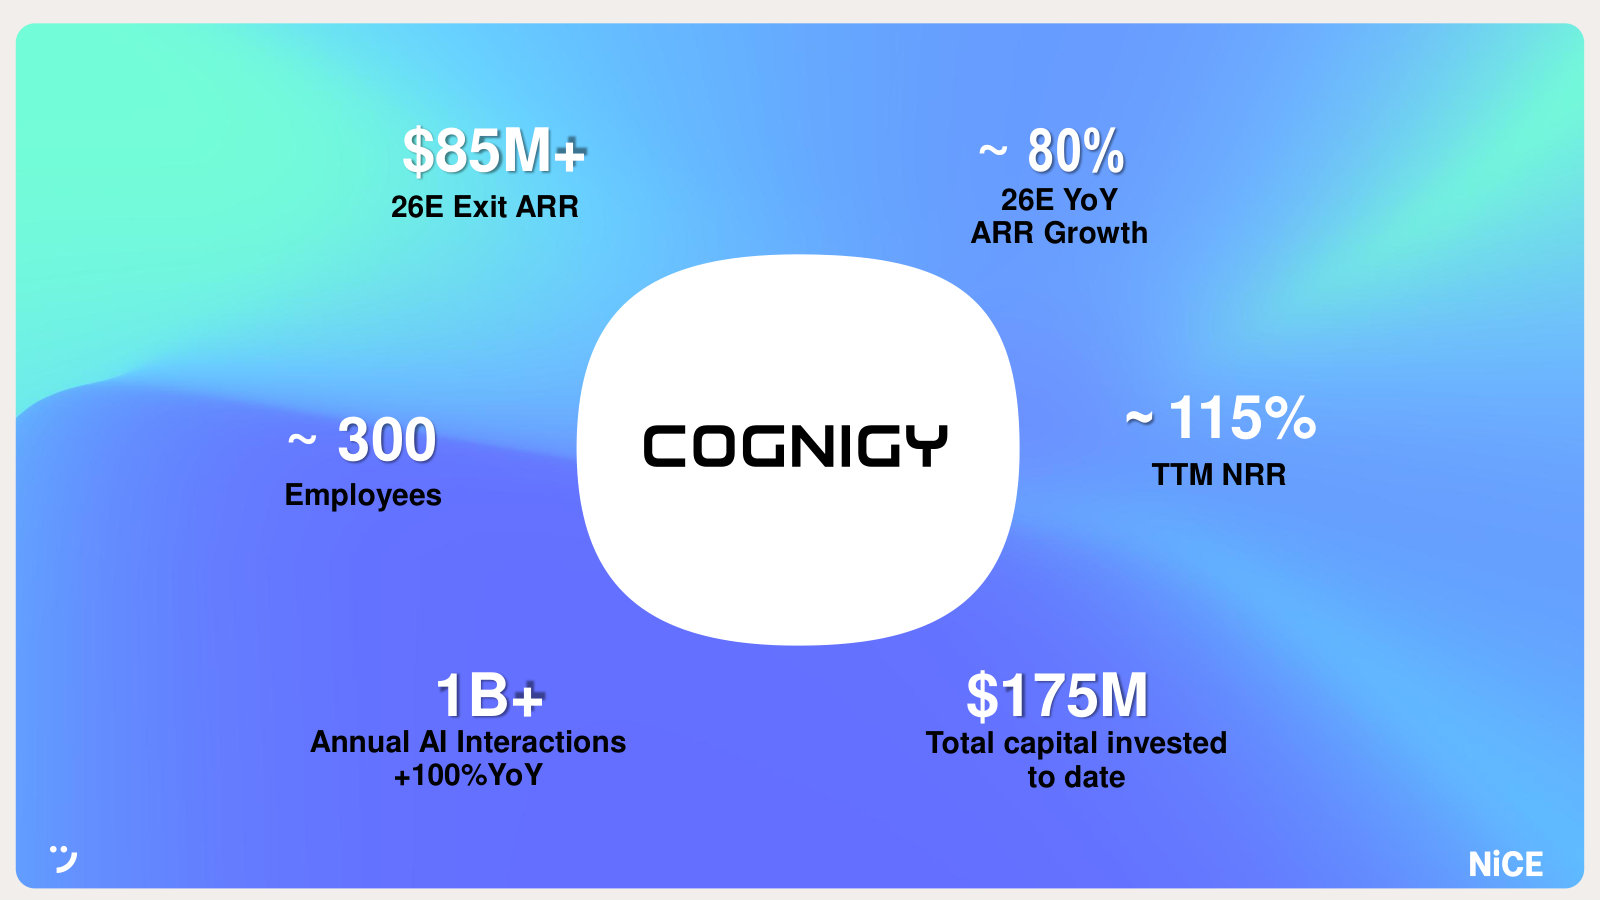
| Cognigy acquisition and integration | emerged | Q2 2025, Q3 2025, Q4 2025, Q1 2026 | Absent before mid-2025, then central: closed in Q4 2025, guided to roughly 200 bps of 2026 cloud contribution and an ~$85M exit ARR, and by Q1 2026 described as integrated into CXone and ahead of schedule. Now management's headline growth lever. |
| Net revenue retention trajectory | persisted | Q1 2025, Q2 2025, Q3 2025, Q4 2025, Q1 2026 | Since NICE began disclosing cloud NRR it has stepped down steadily — 111% through 2025, 109% at year-end, and 107% in Q1 2026. Management frames the decline as a lagging metric and near-term mix effect from the AI transition; it is the clearest quantitative pressure point in the reported numbers. |
| On-premise to cloud migration and elongated deployment ramps | persisted | Q2 2023, Q4 2023, Q3 2024, Q4 2024, Q1 2025, Q1 2026 | A recurring gating factor: large enterprise and financial-crime term renewals stay on premise longer, and bigger AI-laden deals take longer to convert bookings to revenue. Management consistently calls this timing, not demand. |
| Portfolio review / potential divestiture of non-CX assets | emerged | Q4 2024, Q4 2025, Q1 2026 | Analysts probed divesting financial crime and public safety as early as Q4 2024 and again on Actimize in Q4 2025, each time deflected. In Q1 2026 management formalized it as an adviser-led exploratory process with no decisions made — a genuine change in posture worth tracking. |
| LiveVox churn as a cloud-growth drag | dropped | Q3 2024, Q1 2025, Q2 2025, Q3 2025 | A prominent negative through 2025 — unanticipated churn that management called a short-term hit — described as stabilized by Q3 2025 and absent from the Q4 2025 and Q1 2026 calls. The disappearance reads as the issue having run its course rather than being unresolved. |
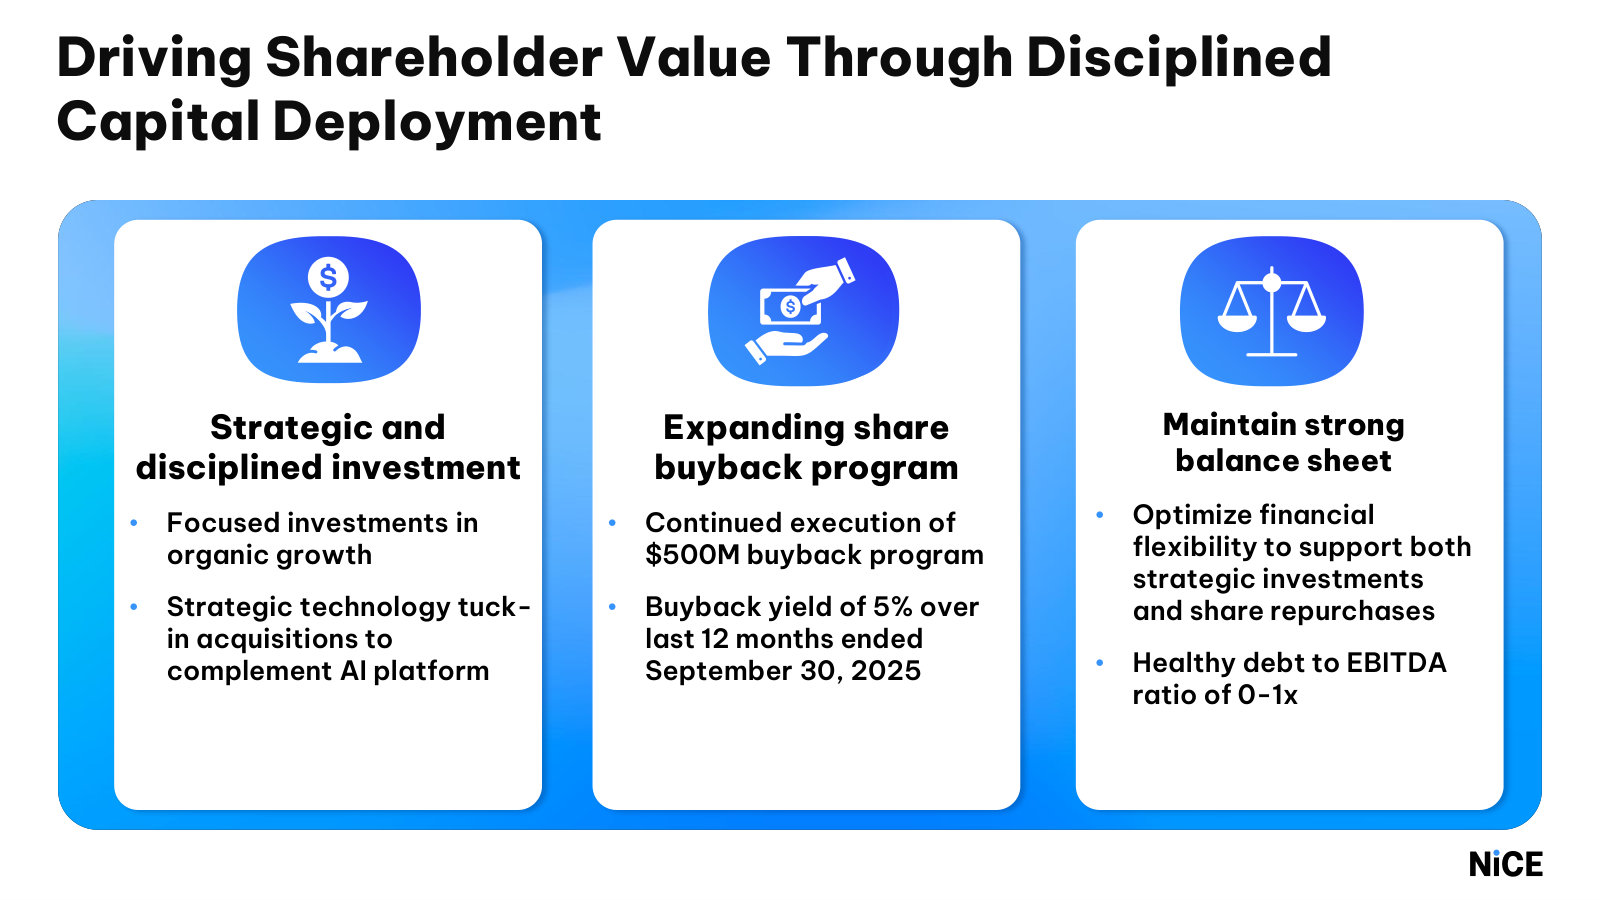
| Capital return via buybacks and debt paydown | persisted | Q2 2023, Q4 2023, Q3 2024, Q4 2024, Q1 2025, Q4 2025, Q1 2026 | Repurchases scaled steadily ($288M in 2023, $369M in 2024, $489M in 2025), debt was fully repaid in 2025, and Q1 2026 included a record $253M quarter with a commitment to exceed 50% of free cash flow. A consistent support to the equity story. |
Guidance ledger
Quotes, calls, and speakers are source-verified; outcomes are curator-classified.
| Verbatim guidance | Call | Speaker | Curator outcome | Outcome note |
|---|---|---|---|---|
| “we still continue to expect to see the 18% growth in the cloud, excluding the LiveVox revenue contribution from the cloud this year” | NICE Ltd., Q2 2024 Earnings Call, Aug 15, 2024 · 2024-08-15T12:30:00 | Beth Gaspich | missed | The organic 18% cloud target was cut to 16%-17% (ex-LiveVox) on the Q3 2024 call, attributed to elongated enterprise deployment ramps. |
| “Our full year 2025 cloud revenue is expected to increase 12% year-over-year.” | NICE Ltd., Q4 2024 Earnings Call, Feb 20, 2025 · 2025-02-20T13:30:00 | Beth Gaspich | kept | FY2025 cloud revenue grew about 13% (roughly 12% excluding Cognigy) per the Q4 2025 call, meeting the organic target. |
| “Full year 2025 fully diluted earnings per share is expected to be in a range of $12.13 to $12.33, which represents an increase of 10% at the midpoint.” | NICE Ltd., Q4 2024 Earnings Call, Feb 20, 2025 · 2025-02-20T13:30:00 | Beth Gaspich | kept | FY2025 non-GAAP EPS came in at $12.30, near the high end of this initial range. |
| “We are raising the full year 2025 non-GAAP fully diluted earnings per share guidance, which is now expected to be in a range of $12.33 to $12.53” | NICE Ltd., Q2 2025 Earnings Call, Aug 14, 2025 · 2025-08-14T12:30:00 | Beth Gaspich | missed | This mid-year raise was walked back to $12.18-$12.32 on the Q3 2025 call for Cognigy dilution; FY2025 EPS finished at $12.30, below the raised range. |
| “We expect cloud revenue growth in 2026 to be in the range of 14.5% to 15% with Cognigy expected to contribute approximately 200 basis points.” | NICE Ltd., Q4 2025 Earnings Call, Feb 19, 2026 · 2026-02-19T13:30:00 | Beth Gaspich | pending | One quarter later, on the Q1 2026 call, the range was widened downward to 13%-15% after the marquee-customer renewal actions; the year is not complete. |
| “Full year 2026 total revenue guidance is expected to be in a range of $3.170 billion to $3.190 billion, which represents an increase of 8% at the midpoint.” | NICE Ltd., Q1 2026 Earnings Call, May 06, 2026 · 2026-05-06T12:30:00 | Beth Gaspich | pending | Reiterated at the Q1 2026 call; the fiscal year is still in progress. |
| “We now expect 2026 cloud revenue growth to be in the range of 13% to 15%.” | NICE Ltd., Q1 2026 Earnings Call, May 06, 2026 · 2026-05-06T12:30:00 | Beth Gaspich | pending | Widened from the prior 14.5%-15%; management expects Q2 cloud growth slightly below the range with a Q3 recovery as AI bookings convert. |
Q&A pressure map
Question counts and firms are curator tallies; analyst coverage shown above.
| Topic | Questions | Firms | Pressure / response |
|---|---|---|---|
| Renewal discounting and near-term CX/cloud compression | 6 | Mizuho Securities, Jefferies, William Blair, Piper Sandler, BofA Securities | The dominant pressure on the Q1 2026 call. Analyst after analyst pressed on why NICE traded near-term CX revenue for AI commitments and whether buyer power had shifted; management repeatedly insisted the action was proactive offense, not a defensive concession. |
| Divestiture of non-CX assets (financial crime, public safety) | 3 | Citizens JMP Securities, BofA Securities, William Blair | Probed since Q4 2024 and again on Actimize in Q4 2025, each time deflected. Even after confirming an exploratory process in Q1 2026, management declined to give specifics on scope or timing. |
| LiveVox churn and its drag on cloud growth | 4 | Morgan Stanley, Citi, Citizens JMP Securities, BofA Securities | Dominated the Q2 2025 Q&A after unanticipated churn pressured the 12% cloud target; management characterized it as a short-term hit and said in-quarter trends had stabilized by Q3 2025. |
| AI cannibalization of seat-based revenue | 3 | Citi, William Blair, BofA Securities | A recurring probe across 2025-2026 on whether AI adoption erodes seat counts and ARPU. Management consistently answered that AI usage is largely incremental and ARPU stable, though it conceded some CX components face compression in Q1 2026. |
Language shifts
Only language evidence verified against the referenced component is shown.
| Observation | Verbatim evidence | Call ID | Component |
|---|---|---|---|
| New caution vocabulary on retention: the Q1 2026 call is the first to openly frame NRR as under pressure and to use 'compression,' where prior calls described NRR as healthy or lagging. | “We are seeing some near-term pressure on NRR as we continue to transition our portfolio towards AI-driven capabilities, which can result in compression in certain CX components.” | 1997148484 | 3 |
| Russell's signature framing since taking over is 'durable long-term growth,' a phrase used to justify near-term trade-offs and repeated throughout the latest call. | “We are taking bold and decisive actions to create durable long-term growth in the CX AI market.” | 1997148484 | 2 |
| A defensive 'offense' posture emerged in Q1 2026 in direct response to analyst pushback on discounting — language that itself signals sensitivity to the buyer-power narrative. | “We're playing offense. We're not trying to defend current contracts and current renewals.” | 1997148484 | 16 |
| For contrast, the first Russell-led call a year earlier leaned on repeated 'prudent guidance' hedging rather than the more assertive commercial-action language of Q1 2026. | “We've taken a prudent guidance. We've taken a prudent guidance” | 1929393285 | 52 |
The call history frames the current debate cleanly: NICE has an unbroken AI-monetization story and record bookings on one side, and on the other a steadily declining NRR, a self-inflicted Q2 cloud-growth dip from marquee-customer discounting, and a newly opened process to divest its non-CX assets. Whether the near-term revenue trade genuinely converts to durable AI growth in 2027, as management insists, is the question the next few quarters will settle.
Competitors describe NICE Ltd.'s market in their own filings and calls. These verified passages and visual pages show where their strategies meet, using source documents preserved in Sources.
Five9 (FIVN)
A pure-play cloud contact-center (CCaaS) vendor and the most direct competitor to NICE's CXone platform. Five9's 10-K names NICE explicitly in its competition section, and management frames the market as a race to fold AI into an integrated CCaaS platform — the same ground CXone contests.
Five9's FY2025 10-K names NICE among the cloud contact-center competitors it faces
Additionally, we compete with vendors that historically provided other contact center services and technologies and expanded to offer cloud contact center software such as Genesys Telecommunications Laboratories, Inc., or Genesys, and NICE Ltd., or NICE. We also face competition from many smaller contact center service providers such as Content Guru and Talkdesk, as well as vendors offering both unified communications and contact center solutions such as RingCentral and Zoom.
p. 13 · Read in context →
Five9 cites Gartner's forecast for the CCaaS and GenAI customer-service markets it and NICE both serve
Gartner forecasts the market for traditional CCaaS to grow at a 9% CAGR and the GenAI customer service market to grow at a 34% CAGR through 2029
p. 1 · Read in context →
Five9's CEO argues AI belongs on one integrated platform rather than point products — the platform-versus-point-solution framing central to CXone's pitch
Amit Mathradas, CEO: That cannot happen with point products; it has to happen on a platform. Everyone is talking about agentic; at Five9, Inc., we are talking about “humanic,” which is the combination of humans and agents doing things that have not been thought about before.
p. 8 · Read in context →
Verint Systems (VRNT)
Verint shares NICE's origins in the call-recording and workforce-engagement market and now positions itself as a pure-play CX-automation vendor. It competes directly with CXone on AI-powered bots, workforce engagement and CX analytics, though it stresses a hybrid, layer-on-top model rather than rip-and-replace cloud migration.
Verint's stated self-description as a pure-play CX-automation company
Dan Bodner, CEO: Today, Verint Systems Inc. is a pure-play CX automation company with a focus on helping brands automate their manual CX workflows. Our platform differentiation stems from many years of experience working with the largest brands in the world on CX initiatives.
p. 1 · Read in context →
Verint's claim that its platform delivers AI outcomes better than any other contact-center vendor
Dan Bodner, CEO: As discussed on prior earning calls, the Verint Open Platform quickly transforms the latest AI technology into tangible AI business outcomes better than any other contact center vendor.
p. 2 · Read in context →
Verint sizes the contact-center automation opportunity it shares with NICE (the elided clause cites roughly $2 trillion of annual CX labor spend)
Dan Bodner, CEO: We believe the AI opportunity in the contact center market is very large. […] brands are seeking AI-powered bots that can deliver tangible business outcomes. We are addressing this very large TAM with a differentiated open platform delivering tangible results to our customers.
p. 1 · Read in context →
Nasdaq Verafin (NDAQ)
Nasdaq's Verafin unit is a direct competitor to NICE's Actimize division in anti-financial-crime, anti-money-laundering and fraud software. Its earnings calls describe a large and growing installed base, Tier-1 bank wins and an agentic-AI compliance roadmap that overlaps squarely with Actimize's market.
Nasdaq reports Verafin's installed base and a Tier-1 bank win (the elided clause cites over $11 trillion in combined client assets)
Adena Friedman, Chair & CEO: Nasdaq Verafin continued to show solid performance across its customer base, which now includes over 2,700 financial institutions […] This quarter, we onboarded Goldman Sachs as a new Nasdaq Verafin client.
p. 2 · Read in context →
Nasdaq describes Verafin's agentic-AI compliance workers — the same automation thesis NICE advances for Actimize
Adena Friedman, Chair & CEO: This week, Nasdaq Verafin announced the launch of its Agentic AI workforce, a suite of digital workers that will deliver a step change in compliance effectiveness and efficiency. Early results from the first 2 agents in beta, the Digital Sanctions Analyst and the Digital Enhanced Due Diligence Analyst demonstrate Agentic AI's potential to address the most resource-intensive compliance workflows.
p. 2 · Read in context →
Nasdaq quantifies Verafin's financial-crime software growth, client additions and net revenue retention
Sarah Youngwood, CFO: Financial Crime Management Technology revenue grew 22% with ARR growth of 18%. We signed 55 new SME clients in the third quarter. Net revenue retention was 111%, reflecting strong client engagement, supported by the increasing adoption of the GenAI entity Research Copilot and targeted typology analytics.
p. 4 · Read in context →
FICO (Fair Isaac) (FICO)
FICO's software segment competes with NICE Actimize in fraud and financial-crime analytics for banks — and its 10-K lists NICE Actimize by name as a primary competitor in that market. FICO is building an agentic, platform-based fraud offering aimed at the same regulated financial-services buyers.
FICO's FY2025 10-K names Nice Actimize first among its competitors in banking fraud software
In the fraud solutions market for banking, we compete primarily with Nice Actimize, Experian, Pegasystems, BAE Systems Applied Intelligence, SAS, ACI Worldwide, IBM, Feedzai and Featurespace.
p. 13 · Read in context →
FICO's CEO describes its agentic platform strategy for the regulated financial-services market Actimize also targets
William Lansing, CEO: FICO Platform is architected from the ground up to be agentic-by-design. That foundation delivers decision-grade analytics, deep domain expertise, and an enterprise platform that clients depend on for precision, consistency, explainability and trust. These principles are nonnegotiable for our primary target market, the highly regulated financial services industry.
p. 1 · Read in context →
Cisco (CSCO)
Cisco is a diversified networking company, but its Webex Contact Center is a live product line competing with NICE's CXone — indeed Five9's own 10-K lists Cisco as a legacy contact-center competitor. The exhibits below are confined to Cisco's Collaboration/Contact Center disclosures, not its networking or security businesses.
Cisco flags Cloud Contact Center as a growth driver within its Collaboration segment
Collaboration grew by 6%, buoyed by strong performance in device sales and growth in CPaaS, Webex, and Cloud Contact Center.
p. 3 · Read in context →
Cisco's FY2025 10-K lists Contact Center as a component of its Collaboration portfolio
Our Collaboration portfolio consists of our Webex suite, collaboration devices, Contact Center and Communication Platform as a Service (CPaaS) offerings.
p. 9 · Read in context →
More peer documents
Five9 Q4 FY2025 earnings call — Q4 FY2025 · 13 pages · Five9 restates the same Gartner CCaaS/GenAI market forecast and reports crossing $100m in enterprise-AI annual run-rate revenue — a read on how fast the AI-CX market NICE contests is scaling. · Open →
Five9 FY2024 10-K — FY2024 · 131 pages · The prior-year competition section, which also names NICE and Genesys, for confirming the competitive framing is consistent year over year. · Open →
Nasdaq FY2025 10-K — FY2025 · 111 pages · Nasdaq's Financial Technology / Anti-Financial Crime segment disclosures — market description and competition for the Actimize-overlapping business. · Open →
Verint Q3 FY2025 earnings call — Q3 FY2025 · 7 pages · Further Verint detail on Da Vinci AI, bot consumption and its CX-automation platform positioning versus cloud-first rivals like CXone. · Open →
FICO FY2024 10-K — FY2024 · 119 pages · The prior-year software-segment competition section, which likewise names Nice Actimize in the banking fraud market. · Open →
Nasdaq Q4 FY2025 earnings call — Q4 FY2025 · 14 pages · Full-year Financial Crime Management Technology growth (22%) and the Agentic AI workforce launch — Verafin's competitive momentum against Actimize. · Open →
Fit
Figures converted from Israeli shekels (₪) at historical FX rates — see data/company.json.fx_rates. NICE reports its financial results in US dollars, so revenue, EPS, FCF, and guidance figures are unchanged; only the shekel share-price and market-cap levels are converted (at ₪→$ 0.32641, applied uniformly so the −29.6% / −40.6% drawdown is preserved). Ratios, margins, and multiples are unitless and unchanged.
Outside the framework's universe (U2 not met); contested: U1, X1, X2, X3, X4, S1
The framework does not proceed on NICE: at a market value of about $6.0B the company sits roughly 40% below the $10B universe floor, and a size miss stops the screen before any pillar can carry it. Verdict: outside the framework's universe. Confidence is low — under the name-mask probe five screening criteria (U1 and the four exclusions) resolved on different labels between the two model families, a prior_driven_risk signal that caps confidence regardless of how clean the underlying facts are. No hard exclusion is triggered; watchlist_only is off. This is a screen result, not a judgment on the business.
Universe and exclusions
Here is the decisive point. NICE misses on size, and nothing downstream can rescue it. At 63.323M shares and a 21 July 2026 TASE close of $95.2 (₪291.8 at ₪→$0.32641), equity value is about $6.0B, cross-checked against the NASDAQ ADR (~$95–101 × 63.323M ≈ $6.0–6.4B) and third-party market data ($5.8–6.3B). The universe floor is $10B. On every basis NICE lands ~40% short. The one honest mitigant, stated in the same breath: this ~$6.0B follows a ~40% ADR decline from a 52-week high near $175, so on its pre-drawdown market cap (~$10.5–11B) NICE would have sat right at the line. Today it does not. U2 → not met, and by the framework's own gate that ends the universe question: U2 not_met → out_of_universe.
Source: market value derived from fit_features.market_cap.native (₪18,477,651,400) × company.json.fx_rates 0.32641, cross-checked to the NASDAQ ADR; the FY2025 20-F reports 60.43M ordinary shares outstanding, so the 63.3M feature basis runs market cap ~7% richer than the primary count.
The remaining screens are clean on the substance:
- U1 — Listing (contested). NICE is a bona-fide U.S.-listed security: NASDAQ ADRs since 1996, a Form 20-F filer as a foreign private issuer, explicitly not a Chinese ADR [1]. The letter of the rule names "US-listed stocks, or European companies with a US-listed ADR"; NICE is Israeli-domiciled, not European, so the geography test is met in substance and ambiguous only on wording — which is why the seats split rather than agreed.
- X1 — Auto/OEM (contested). No automotive or hardware-OEM exposure: the two reportable segments are Customer Engagement software ($2,459,974K) and Financial Crime & Compliance software ($485,425K) [2]. The car-company exclusion does not bite.
- X2 — Promotion pattern (contested). Management's promise-versus-delivery is mixed but not promotional — it kept its FY2025 cloud and EPS guides while missing an 18% FY2024 cloud target and walking back two mid-year raises — with clean governance and thin 0.7% insider ownership. Not a framework exclusion; the full record is in Self-Help.
- X3 — Structural decline (contested). Revenue rose every year for seven, $1,573.9M (2019) to $2,945.4M (2025);
consecutive_decline_years = 0,three_year_hsd_decline = false. The disqualifier is absent, though growth decelerated to +7.7% and the legacy services and product lines are already shrinking within the mix. See Durability. - X4 — Consensus-saturated story (contested). NICE trades at ~2.05x sales and ~10x earnings after a ~40% ADR fall driven by AI-disruption fear — a value multiple, not a darling's. The reverse risk is that the de-rating is deserved; that is the Damage Math question, not an exclusion.
- S1 — China dependence (contested). APAC is 5.3% of revenue in total ($154.7M of $2,945.4M), so China is at most a low-single-digit share and is not separately disclosed as material; the large APAC workforce is India-based engineering and support [3]. The real geopolitical exposure is Israel, which the China screen does not address.
None of these five is a genuine two-sided disagreement about whether the exclusion fires — on both model families' readings, none fires. They register as "contested" because one family recorded "not met" and the other "not hit," and that labeling split is what the name-mask probe surfaced. It is reported as contested here because the tally records it as contested; it is not softened, and it does not change the gate.
Pattern match
NICE fits the quality tech monopoly/duopoly on a fear dip setup only in part, and none of the other three cleanly. The dip is real and event-dated (a 40.6% peak-to-trough fall on a forward-guidance reprice, Dislocation), the business is a durable category leader with ~39 years of history, and the fear is specific and testable — that agentic AI erodes NICE's per-seat pricing. What the pattern requires and NICE does not supply: the setup's precedents (Meta, Amazon, Google at ~$90 in 2022) were $250B–$1T names inside the universe, and the "monopoly/duopoly" leg is a contested CCaaS oligopoly, not a structural gate. It matches none of the cyclical-bank, high-dividend-yield, or insurance-forecasting-error patterns. So: a partial match to one pattern, on a name the size screen has already put out of the universe.
The pillar ledger
Each pillar below states the criterion, its reference line, where NICE sits in arithmetic, and — in the same treatment — the strongest surviving fact the other way. Reference lines, never grades.
Source: ruchir/fit_tally.json criterion aggregates; supporting arithmetic derived from the surviving claims and the FY2025 20-F, cited in each pillar treatment below.
Year-10 gate — P1
The one pure gate is binary: will year-10 revenue and adjusted FCF both be higher, with very high conviction? The jury says no — all four seats returned not met, trimmed-mean probability 0.61, spread 0.07, both families agreeing. The arithmetic behind the doubt: of the framework's five conviction sources, only long operating history applies cleanly (founded 1986, ~39 years). Capital intensity gives no moat (capex/revenue = 3.2%). There is no regulatory entry barrier on Customer Engagement, which is 83.5% of revenue. Market structure is a contested oligopoly — NICE competes against Amazon Connect, Avaya, Cisco, Five9, Genesys and TalkDesk plus AI-native entrants [4] — not a monopoly or duopoly. And NICE's own 20-F flags that AI may "decrease in demand for solutions priced based on the number of human agents deployed" [5]. The strongest fact against the doubt sits in the same frame: a ~39-year survivor that already navigated on-premise-to-cloud, still compounds cloud revenue double digits (76% of revenue), and targets over $1B of AI revenue by 2028 is strong evidence year-10 revenue is higher — the doubt is about the conviction level the binary gate demands, not the direction. Full treatment in Durability.
Consistency — P2
The test is a stable rolling five-year average of adjusted FCF. The verdict is cannot determine, and the reason is a specific missing input: adjusted FCF exists for only three consecutive years (~$148M / ~$391M / ~$175M, 2023–2025 — lumpy on acquisition timing), and stock-based compensation is absent from the feature build for the earlier years, so the deterministic rolling average and coefficient of variation cannot be computed. One jury seat read the lumpiness as not met; three could not settle it. Note that the reader-facing "reported FCF has been positive and rising for seven years, so consistency holds" argument was refuted by the skeptic — the framework's basis is adjusted FCF, not reported, so the reported-FCF record supports nothing here. The named missing datapoints, verbatim from the jury:
The counter-fact: the five-year averaging of acquisitions is itself the framework's remedy for lumpiness, so volatility in adjusted FCF is expected rather than disqualifying — which is precisely why the honest answer is cannot determine, not not met. See Yield.
Dislocation and yield — P3
The dislocation is genuine and the entry conditions are met; the yield is not. P3a (identifiable event) — met: a single dated trigger, the 6-May-2026 Q1 report, on which the stock fell 18.8% in one session — even though the quarter itself beat and management raised full-year EPS guidance to $10.98–$11.18 [6]; the adverse signal was the forward growth/margin trajectory (Q2 guided to +5.5%, cloud NRR 107%). P3b (capitulation) — met: volume spiked 3.3x over the fall, the heaviest session running 13.8x its average near the June trough — a washout signature, albeit on a pre-peak baseline truncated to ~30 trading days by the six-month price feed. P3c (yield vs bar) — not met: NICE's net-cash balance sheet selects the fortress bar of 8–9%, and on the framework basis (reported FCF − SBC − 5-year-average acquisitions) FY2025 adjusted FCF is $175.0M, a 2.9% yield on ~$6.0B — roughly 560 bps short; even the charitable ex-Cognigy treatment reaches only 5.7% [7]. The counter-fact stands beside it: reported FY2025 FCF yield is ~10.3% and the SBC-only-adjusted yield is ~7.9%, so a screen that skips the M&A adjustment would show NICE at or above the bar. P3d (forward path) — not met: consensus reported-FCF yields of 9.8%–13.8% (FY2026–FY2029) clear the bar, but on the adjusted basis reaching 8% by ~2028 needs the acquisition engine to stop, which NICE's serial-acquirer record argues against — estimated probability ~0.305, spread 0.03, both families agreeing. Full workings in Yield.
Balance sheet and self-help — P4
Capital allocation is the framework's flywheel, and here it is intact. P4a (outlast + headroom) — met: NICE entered the dislocation debt-free after settling its $460M notes in cash at maturity in September 2025, with $417.4M of cash and short-term investments (cash $379.4M + ST investments $38.0M) [8] and a $300M undrawn revolver; net debt/EBITDA is −0.49x. The cushion is thinner than a year ago, though — liquidity fell from ~$1.62B to $417.4M to fund Cognigy and the note repayment. P4b (repurchase engine) — met: buybacks are executed, not just authorized — $488.9M in 2025 (up from $144.9M in 2022) plus a record $253.3M in Q1 2026 [9] — with share count falling. The counter-fact: SBC of $146–182M a year and the part-stock Cognigy deal hold the net reduction to ~1.6%/yr, so the float is retiring slowly. P4c (dividend cover) — not applicable: NICE pays no ordinary dividend and states no plans to initiate one [10]; there is nothing to cover, and the return case rests entirely on repurchases. Detail in Self-Help.
Diagnosis — P5
The question is whether the impairment is temporary. The verdict is met — the market erased 29.6% of NICE's equity value peak-to-current (40.6% peak-to-trough), while a transparent two-scenario NPV of the near-term hit destroys only ~1.6% of pre-shock value if temporary and ~10–18% if permanent; the residual gap is a multiple de-rating, not a cut to cash flows. The profile's adversarial trial — two cited briefs, three blind judges — put the probability the impairment is temporary at 0.61 (range 0.58–0.62, spread 0.04, not contested). The counter-fact carried in the same ruling: NICE shows real structural-decline signals — cloud growth decelerated to ~12% ex-Cognigy, NRR at 107% with management-flagged near-term pressure [11], and a seat-to-consumption pricing reset the filing warns can commoditize its products — which is exactly why the judges landed at 0.61 rather than resolving it either way. The two cases are laid out fairly in Damage Math.
Instrument context — I1
Facts only, no advice. Listed options on the NASDAQ ADR run out to a 21-Jan-2028 LEAP (~18 months), clearing the framework's ≥12-month (target ≥18) line, with near-money open interest in the hundreds to low thousands. But the tally records I1 as not verifiable: the only implied-volatility reading available (~58–62%, elevated on the reference lines) is a near-dated August-2026 ATM figure that spans the 5-Aug earnings, from a delayed public feed rather than real-time exchange data, and a clean long-dated IV could not be confirmed. So the instrument exists; the volatility level the framework would read cannot be verified from the corpus. See Clock.
What a 3x-in-3-years would require
The tally's re-rating math is unavailable, by its own note:
Re-rating math unavailable because the applicable bar or normalized adjusted FCF is missing.
Both inputs are missing for good reasons — the name misses the universe screen, and fit_features could not compute a native USD market cap or a normalized adjusted FCF (FX was not applied in the feature build; SBC was absent). So the framework does not open a target price. The closest available arithmetic points the other way: on the reconstructed adjusted basis, FY2025 adjusted FCF of $175.0M against ~$6.0B is a 2.9% yield, and reaching even the 8.5% fortress bar would require the price to fall to roughly $2.1B — not a 3x up but a further ~65% down — unless adjusted FCF roughly triples first via a halt to acquisition spend. The base-rate context from Clock: NICE's prior guide-driven drawdowns round-tripped in about four months (the ~20% November-2025 fall recovered to a new high by March 2026), but the current 40.6% episode is roughly double the deepest bracketable precedent, so that round-trip cannot simply be extrapolated. Stated as arithmetic against the framework's reference lines; not a recommendation.
Contested and undetermined
Contested (six criteria). U1, X1, X2, X3, X4 and S1 are all flagged contested. On the merits, none is a live dispute about the outcome: the listing is a genuine U.S.-accessible ADR (Israeli, not European, by the letter), and none of the four exclusions plus the China screen is triggered on either family's reading. The contest is a labeling divergence — one model family recorded "not met," the other "not hit" — and that split is what the name-mask probe caught and what holds confidence at low. Reported as contested because the tally records it as contested.
Undetermined (one criterion). P2 (FCF consistency) is cannot determine — the deterministic rolling-five-year adjusted-FCF series cannot be built because SBC is missing for the earlier years and only three consecutive adjusted-FCF years exist (the named datapoints are listed under the P2 treatment above).
Provenance
| Item | Result |
|---|---|
| Jury composition | 4 seats + 1 masked; families claude (a, b, masked) and codex (c, d) |
| Agreement / spread | P1 0.61 (spread 0.07), P3d 0.305 (0.03), P5 0.61 (0.04); both families agreed on P1, P3c, P3d, P5 |
| Trial order-stability | temporary-first mean 0.58, permanent-first mean 0.615, gap 0.035 |
| Name-mask probe | gate criteria U1, X1, X2, X3, X4 resolved differently under mask; max probability gap 0.005 → prior_driven_risk = true |
| Skeptic counts | 17 adjudicated — 13 survived, 2 weakened, 1 refuted, 1 unverifiable — plus 22 triaged-only |
Source: ruchir/fit_tally.json provenance block and ruchir/trial/tally.json.
Two sentences of plain reading. The verdict was pressed hard — a four-seat two-family jury, an adversarial temporary-versus-permanent trial with three blind judges, a claim-level skeptic that refuted one reader-facing claim and weakened two more, and a name-mask probe that re-ran the screen with the company's identity hidden. That last probe is why confidence is low: with the name masked, five of the screening criteria came back on different labels, so the framework flags a risk that a prior was doing some of the work — even though the size miss that decides the verdict is unambiguous either way.
The falsifier ledger
These are the standing what-would-change-this conditions carried from the tally — the first five are the framework's generic templates, the rest the trial's name-specific flip conditions with their thresholds, directions and windows:
Data gaps
- No native USD market cap in
fit_features(reporting currency USD but price currency ILS, FX not applied), so all market-cap USD figures are derived by applying ₪→$ 0.32641 uniformly; a per-period FX split would break the −29.6% / −40.6% drawdown percentages, so a single rate is used deliberately. - Adjusted FCF and its yield are
not_computableinfit_features: SBC is absent from the feature build (present in the 20-F at $146.0M for FY2025) and there is no clean five-year acquisition window, so the acquisition drag is bounded, not precise; the figures used here are the Yield tab's reconstruction from the filed cash-flow statements. - The rolling five-year adjusted-FCF stability series (
fit_features.fcf_stability) is not computable — fewer than five consecutive adjusted-FCF years exist (the exact missing inputs are listed under P2). - Share-count basis differs:
fit_featuresuses 63.3M while the 20-F reports 60.43M outstanding at year-end and management cited ~58.5M by end-March 2026, so per-share figures run ~7% richer on the feature basis than on the primary count. - Price/volume history is a partial six-month web feed (23 Jan – 21 Jul 2026), so the $135.2 peak is a window high rather than a verified multi-year top, and the capitulation baseline is truncated to ~30 trading days.
- China revenue is not separately disclosed; the 5.3% APAC total is an upper bound, not an exact China figure.
- A clean long-dated (Jan-2028) implied-volatility reading was not separately verifiable; the ~58–62% figure is a near-dated August-2026 ATM reading spanning the 5-Aug earnings from a delayed public feed.
- No official short-interest data exists for the TASE-listed security, so forced/short-driven selling cannot be quantified.
Figures converted from ILS at historical FX rates — see data/company.json.fx_rates. Ratios, margins, and multiples are unitless and unchanged. (NICE files its financial statements in U.S. dollars, so only the share quote and market capitalization — natively in shekels on the Tel Aviv Stock Exchange — were FX-converted; the financial-statement figures are as-filed in USD.)
Business
NICE is a ~40-year-old Israeli enterprise-software company that sells two things: cloud contact-center software (CXone, ~84% of revenue) and financial-crime/compliance software (Actimize, ~16%). Revenue of $2,945M grew 7.7% in FY2025, 76% of it recurring cloud, with net income of $612M and free cash flow of $623M. It is a genuine market leader — but on Ruchir's universe screen it misses on size: the equity is worth roughly $6.0B, well under the $10B line.
NICE reports its financial statements in U.S. dollars ($); its shares trade in New Israeli Shekels on the Tel Aviv Stock Exchange and as U.S.-dollar ADRs on NASDAQ. Financial-statement figures below are in $ as filed; the share quote and market capitalization are shown in $ (converted from the shekel trading quote).
What NICE Is
NICE (NASDAQ and TASE: NICE) is "a global enterprise software leader, delivering mission-critical AI-powered cloud platforms that serve two main markets: Customer Engagement and Financial Crime and Compliance" [1]. In plain terms: enterprises that run large call centers pay NICE to route, record, analyze and increasingly automate customer interactions; banks and brokers pay NICE to catch money-laundering, fraud and market-abuse in real time. Both are subscription software businesses sold to large institutions, and both are being rebuilt around AI.
The company was founded on 28 September 1986 as Neptune Intelligent Computer Engineering, renamed NICE-Systems in 1991, bought Actimize (financial crime) in 2007, bought inContact in 2016 to enter cloud contact-center, and bought the conversational-AI vendor Cognigy in 2025 [2]. That gives it roughly four decades of operating history — a point the Durability tab will weigh.
Two segments, one dominant
Source: FY2025 Form 20-F, Note 16 — Reportable Segments [3].
Customer Engagement is the engine: $2,460M of FY2025 revenue and $665M of segment operating income; Financial Crime & Compliance added $485M of revenue and $167M of operating income, before $186M of unallocated cost [4]. Both segments carry software-grade margins (27% and 34% at the segment line), and the two together make NICE a single-product-family story with a smaller, stickier compliance annuity attached.
A recurring, cloud-first model
Source: FY2025 Form 20-F, Item 5 — Results of Operations [5].
Cloud revenue reached $2,238.4M, or 76.0% of total, up 12.8%, while legacy services (−6.0%) and product (−5.2%) shrink as on-premises customers migrate [6]. The mix shift — a growing cloud annuity replacing a declining licence/maintenance base — is why headline growth (7.7%) runs below cloud growth (12.8%).
Geography and scale
Revenue is heavily concentrated in the Americas — $2,465.6M, roughly 84% of the total — with EMEA at $325.1M (11%) and APAC at $154.7M (5%) [7]. The workforce is distributed differently: of 9,626 employees at year-end 2025, 3,997 sit in APAC and 3,860 in the Americas — a large offshore engineering and support base (India) serving a market that is overwhelmingly North American [8].
Revenue FY2025 ($M)
Net Income ($M)
Free Cash Flow ($M)
Employees
Sources: FY2025 Form 20-F — Consolidated Statements of Income [9] and Item 6.D Employees [10]; free cash flow per company filings (operating cash flow of $716.5M less $93.7M capex).
The balance sheet is close to net cash: about $417M of cash and short-term investments against the 2020 exchangeable notes (~$460M) that were repaid in 2025, leaving little debt — the full picture belongs to Self-Help. Capital intensity is minimal: capex ran $93.7M, or 3.2% of revenue.
The Universe Screen
NICE clears the geography test and misses the size test.
Listing (U1). NICE is an Israeli company (incorporated under Israeli law, headquartered in Ra'anana) whose ordinary shares have traded in Tel Aviv since 1991 and whose ADRs have traded on NASDAQ since 1996; it files a Form 20-F as a U.S. foreign private issuer [11]. It is a bona-fide U.S.-listed security, not a Chinese ADR — the exclusion Ruchir's universe is built to catch. The one nuance: his geography rule reads "US-listed stocks, or European companies with a US-listed ADR," and Israel is not, strictly, Europe. It is fully U.S.-accessible on NASDAQ, so the substance of the screen is met; the letter is a judgment for the Fit tab.
Market cap (U2). This is the clean miss. NICE has 63.3M shares outstanding. At the 21 July 2026 Tel Aviv close the equity is worth about $6.0B; the NASDAQ ADR trades near $95–101, and third-party market data in July 2026 puts the market cap at $5.8–6.3B. Against Ruchir's $10B universe line, NICE sits about 40% short.
Market Cap ($M ≈ $6.0B)
Universe Line ($10B)
Sources: shares outstanding per FY2025 Form 20-F [12]; TASE close 21 Jul 2026 (company price feed); NASDAQ ADR quote and market-cap range per market data, July 2026; ILS→USD at 0.326 (company FX table). Derived: fit_features.market_cap.native = ₪18.48B; market_cap.usd is flagged not_computable (FX not applied in the feature build), so the $6.0B figure is supplied here from the dated FX and the live ADR quote.
Universe screen: NICE clears the listing test (NASDAQ-listed, not a Chinese ADR) but misses the size test — a market capitalization of about $6.0B against the $10B line.
Market Structure — the Durability Raw Material
NICE competes as a leader inside a competitive oligopoly, not a monopolist or a protected duopoly. That distinction is the material fact for Durability.
Named competitors, by arena. NICE's own 20-F lists them:
Source: FY2025 Form 20-F, Item 4.B — Competition [13].
The leadership claim is not just management's. NICE has been a Gartner Magic Quadrant Leader for Contact Center as a Service for an eleventh consecutive year [14], and a Leader in the 2025 Gartner Magic Quadrant for Enterprise Conversational AI Platforms [15]; it positions itself as the "#1" across the customer-engagement stack per Gartner, Forrester and IDC [16]. Eleven years at the top of an analyst quadrant is real evidence of durability of position.
But the moat is scale and switching cost, not a regulator's gate. Nothing stops a well-funded rival from selling contact-center software: entry is not licence-gated the way banking or insurance is. The CCaaS market itself is described as still "mainly held by traditional on-premises players," so share is contestable in both directions [17]. Capital intensity is low (3.2% of revenue), so it is not a capital-heavy essential that survives by balance-sheet scale. What NICE has instead is embeddedness — mission-critical, high-volume, regulated workflows with high switching costs — plus a proprietary data and analytics estate. In Ruchir's terms, execution is not a moat; the question is whether the position is structurally defended.
The live fear is AI disintermediation of the seat-based model. NICE prices much of Customer Engagement per human agent, and the company itself flags the risk in its 20-F: "a shift from seat-based recurring revenue to consumption-based revenue, or decrease in demand for solutions priced based on the number of human agents deployed" [18]. If AI agents replace human agents faster than NICE can re-price to consumption and capture the automation itself, seats — and revenue — could fall even as NICE stays the "leader." That is the exact debate the Durability and Damage Math tabs adjudicate; this tab records that the market is an oligopoly with low regulatory barriers and a genuine technology-transition risk, not a franchise sitting behind a legal wall.
First-Pass Exclusion Screen
Auto / OEM (X1) — not applicable. NICE is enterprise software with no vehicle, hardware-OEM, or automotive exposure. This exclusion does not bite.
Darling positioning (X4) — not triggered; the opposite. A consensus-saturated darling trades on a rich multiple-to-sales with a bottom-left-to-top-right chart. NICE trades on value multiples after a large decline.
Source: derived from FY2025 reported financials (revenue $2,945M, EPS $9.67, FCF $623M, ~$417M net cash) and a ~$6.0B market cap; ADR ~$95–101, July 2026 market data.
At roughly 2x sales and about 10x earnings, NICE is priced like a decelerating incumbent, not a story stock — and the ADR is down from a 52-week high near $175 to roughly $100, a fall of about 40% driven by AI-disruption fear rather than euphoria. The coverage tone is skeptical, not adoring. On Ruchir's exclusion this is a clean pass; whether the fear is a deserved re-rating or an over-shoot is the work of the Dislocation and Damage Math tabs.
China dependence (S1) — immaterial. NICE discloses revenue only by Americas / EMEA / APAC. Total APAC revenue is $154.7M, 5.3% of the company; China is a subset of that, so China revenue is at most a low-single-digit share and is not separately material [19]. The large APAC headcount is India-based engineering and support, not China operations [20]. No China sensitivity flag attaches. The one geopolitical fact worth noting is the reverse: NICE's core R&D and domicile are in Israel, an exposure the risk factors acknowledge but which is outside this screen.
Figures converted from Israeli shekels (₪) at historical FX rates — see data/company.json.fx_rates. NICE reports its financial results in US dollars, so revenue, EPS, and guidance figures are unchanged; only the shekel share-price levels are converted (at ₪→$ 0.32641, applied uniformly so the −40.56% drawdown is preserved). Ratios, margins, and multiples are unitless and unchanged.
Dislocation — what exactly happened to the price
There is a real dislocation, with a dated trigger. NICE fell 40.6% from its 5-March-2026 peak ($135.2) to a 19-June trough ($80.4), and sits at $95.2 — 29.6% below the high. The event leg was the 6-May Q1 2026 report: a revenue and EPS beat with raised full-year EPS guidance, sold off 18.8% in one session on a soft Q2 growth guide and AI-driven retention pressure. The price fall far outran the estimate change.
NICE reports its financial results in US dollars but its shares trade in shekels on the Tel Aviv Stock Exchange (with NASDAQ ADRs). Price and drawdown figures below are shekel closes converted to dollars; revenue, EPS, and guidance are in $ as the company reports them. The companion page shows the native shekel price levels.
The drawdown — a 41% fall in one quarter, with a clean event leg
Peak — 5 Mar 2026 ($)
Trough — 19 Jun 2026 ($)
Current — 21 Jul 2026 ($)
Peak-to-Trough Depth
Source: daily price history, TASE close (data/prices/daily.json), converted to USD; drawdown levels and −40.56% depth per the deterministic feature file (fit_features.capitulation_gauge.drawdown).
The peak-to-trough fall of 40.6% took 106 days and ran in two distinguishable phases. From the 5-March high of $135.2, the stock drifted down to about $99 by late April — a 27% decline with no NICE-specific event and only moderate volume, the kind of drift the framework treats as the start of the slide rather than the moment. It then spiked 21.3% to $121.6 on 4 May on reports that NICE had drawn roughly $2.5 billion of bids for its Actimize financial-crime unit [1]. Two sessions later the event leg hit: a single-day 18.8% collapse on 6 May that reset the trend and carried price to the $80.4 trough on 19 June before a partial recovery to $95.2.
A caution on the raw series: the price feed is a six-month web-sourced history (23 January to 21 July 2026), so the $135.2 "peak" is the high of this window, not a verified multi-year top, and the 180-day pre-peak baseline used for the volume gauge is truncated to about 30 trading days. The percentage drawdown is robust to these limits; the absolute price levels should be read as the feed reports them.
The trigger — a beat-and-raise the market sold 18.8%
The dated adverse event is the first-quarter 2026 report, released 6 May 2026 before the US open [2]. On its face the print was strong. Revenue of $768.6 million rose 9.8% and beat consensus by 1.0%; non-GAAP EPS of $2.64 beat by 4.8%; both cleared the high end of guidance, and management raised full-year EPS guidance to $10.98–$11.18 [3]. AI ARR grew 66% year over year to $345 million. Against that, the stock fell from a $120.7 intraday high to a $93.7 low, closing down 18.8%.
Source: reported actuals, Q1 2026 press release [4]; consensus as-of from CapIQ estimates (data/sp/estimates.json, beat_miss).
What repriced the stock was the forward setup, not the quarter. Three items in the same release and call carried the signal:
- Second-quarter revenue guidance of $761–771 million implies just 5.5% year-over-year growth at the midpoint — a sharp step down from the 9.8% just reported [5]. Full-year cloud growth was guided to 13%–15% [6], well below the roughly 25% cloud growth NICE ran two years earlier.
- Cloud net revenue retention fell to 107%. The CFO tied it directly to the AI transition: "we are seeing some near term pressure on NRR as we continue to transition our portfolio towards AI driven capabilities which can result in compression in certain CX components" [7].
- Pricing concessions to marquee accounts created a Q2 timing hole: management took "renewal specific commercial actions to accelerate AI expansion," producing "phasing effects… with a more pronounced impact expected in Q2," so Q2 cloud growth would run "slightly below our full year range" [8].
The mechanism behind the fear is concrete: agentic AI displaces the human contact-center seats NICE has historically billed against, and the AI ARR growing at 66% is not yet large enough (14% of cloud) to offset the seat compression showing up in retention. Organic cloud growth, stripping out the Cognigy acquisition, was closer to 12% than the headline 14.6% [9]. The market repriced NICE's growth trajectory and multiple, not its 2026 earnings line — which management raised.
This is not the first time. The identical pattern — a beat overwhelmed by a soft cloud guide and AI-substitution worry — drove a roughly 20% single-quarter plunge in November 2025 and a plunge on the February 2025 outlook [10]. The 6-May move is the latest and largest instance in the corpus, and it is the leg that defines this drawdown.
The fear gauge — capitulation volume, clustered late in the fall
Source: daily volume (data/prices/daily.json); spike multiples per the feature file (fit_features.capitulation_gauge.volume_spike) and data/tech/unusual_volume.json.
The volume did spike, and the measured multiple is 3.3x — the peak-to-trough leg's heaviest 20-day average volume against the median daily volume of the 180 days before the peak (fit_features.capitulation_gauge.volume_spike). Two features matter for reading it as emotion-driven rather than orderly. First, the event day itself (6 May) traded 665,650 shares, 2.83x its 50-day average, confirming forced repricing on the news [11]. Second, and more telling, the single heaviest session of the entire window was 29 May at 4.73 million shares — 13.8x the 50-day average — on a close of $81.6 that moved only −3.0%. High volume with almost no price change, arriving near the trough rather than at the March top, is the washout signature: the marginal seller was being cleared out late in the fall, consistent with the framework's "peak fear, not the start of the slide." (The May-29 anomaly is also consistent with index-rebalancing flow, though the corpus does not confirm a specific index event.)
Who was selling — a data gap on shorts, and a company buying its own fall
Official short-interest data is not available for a TASE-listed security in this run: no deterministic public short-interest source is configured for Israel, and the latest snapshot returns status "unavailable" (data/short_interest/latest.json). Short-interest level and change cannot be quantified here — a genuine gap, not a zero.
What the record does show is that the largest identifiable buyer through the drawdown was the company itself. NICE repurchased a record $253 million of stock in Q1 2026 — about 3.5% of its market capitalization — cutting weighted diluted shares roughly 5% year over year to about 58.5 million, and exited the quarter with $745 million of buyback authorization remaining and a commitment to repurchase more than 50% of free cash flow for the year [12]. On the seller side, the recurring "sell-the-guide" reaction across three consecutive outlook events (Feb 2025, Nov 2025, May 2026) points to a holder base that repeatedly repositions on decelerating cloud guidance rather than to a single forced liquidation [13]. No fund liquidation, index exit, or insider sale is disclosed in the corpus. The seller composition is therefore best described as anchored, guidance-reactive selling against a heavy corporate bid — with the short leg unquantifiable.
Estimates versus price — the fall outran the cut
This is the framework's signature, and it is pronounced here. Across the drawdown, forward estimates barely moved while price fell 40.6%. Full-year 2027 revenue consensus was trimmed only 1.3%, from $3,532 million in January to $3,486 million by June; over the same span, 2027 EPS consensus was revised up 5.1%, from $12.49 in April to $13.13 by July (CapIQ consensus). At the event itself the company raised full-year 2026 EPS guidance to $10.98–$11.18 rather than cutting it [14], and consensus 2026 EPS sits near $11.11, inside that raised range.
Source: price per fit_features.capitulation_gauge; estimate revisions from CapIQ momentum series (data/sp/estimates.json), FY2027 revenue and normalized EPS.
Consensus estimates fell fractionally, and after — not before — the price; the near-term FCF path dips modestly (FY2026 consensus FCF $589.8 million against FY2025's $648.6 million) before reaccelerating to $694.8 million in FY2027, per CapIQ consensus. A price that fell 40.6% while forward EPS estimates were flat-to-higher is a fall driven by multiple compression, not by the earnings the sell side actually forecasts. Whether that compression is deserved — whether AI-driven seat displacement permanently impairs NICE's economics or merely reprices one year — belongs to the Damage Math tab and the trial, not here.
Bottom line
NICE presents a genuine dislocation with a dated trigger and capitulation volume: a 40.6% peak-to-trough fall whose defining leg was the 18.8% single-session drop on the 6-May-2026 Q1 report — a revenue-and-EPS beat with raised full-year EPS guidance, sold off on a 5.5% Q2 revenue guide, cloud growth decelerating to 13%–15%, and net-revenue-retention compression the CFO attributed to the AI transition. Volume spiked 3.3x with the heaviest, lowest-price-change session near the trough. Forward estimates fell only low-single-digits — EPS actually rose — so the price fall clearly outran the estimate change. The unquantifiable short-interest picture and the six-month, shekel-denominated price feed are the honest caveats.
Figures converted from Israeli shekels (₪) at historical FX rates — see data/company.json.fx_rates. NICE reports its financial results in US dollars, so revenue, EPS, FCF, and guidance figures are unchanged; only the shekel share-price and market-cap levels are converted (at ₪→$ 0.32641, applied uniformly so the −29.6% / −40.6% drawdown is preserved). Ratios, margins, and multiples are unitless and unchanged.
Damage Math — the value destroyed versus the price destroyed
NICE's shares fell 29.6% from their March 2026 peak (40.6% peak-to-trough) around a Q1 print that cut FY2026 non-GAAP EPS guidance to $10.98–$11.18, roughly 10% below FY2025's $12.30, while revenue guidance held at +8%. A transparent two-scenario NPV puts the value the near-term hit destroys at about 1.6% of pre-shock value if temporary and 10–18% if permanent. The price erased far more; the residual is a multiple de-rating. Independent judges put the probability the impairment is temporary at 0.61.
NICE reports results in US dollars but its shares trade in shekels on the Tel Aviv Stock Exchange (NASDAQ ADRs alongside). Price and market-cap figures below are shekel levels converted to dollars; revenue, EPS, FCF and guidance are in $ as the company reports them. The companion page shows the native shekel price levels.
The near-term hit — one line, one year
The trigger was the 6-May-2026 Q1 report. The quarter itself beat: revenue +9.8% to $768.6M, non-GAAP EPS $2.64 against a $2.52 consensus [1]. What repriced the stock was the outlook: management revised full-year non-GAAP EPS to a range of $10.98–$11.18 — a ~9.9% step-down from FY2025's $12.30 — while reiterating revenue at $3,170–$3,190M (+8.0% at the midpoint) and guiding Q2 revenue to just +5.5% [2].
The hit is an earnings and margin event, not a revenue decline. Revenue still grows ~8%; the cut lands on profit. FY2025 non-GAAP operating margin was 30.8% [3]; Q1 2026 printed 26.0% versus 30.5% a year earlier, with non-GAAP gross margin 68.4% versus 69.9% [4].
FY2026 revenue guide (YoY)
FY2026 EPS vs FY2025 $12.30
FY2026 FCF consensus vs FY2025
Q1 2026 non-GAAP op margin
Sources: FY2026 guidance and Q1 margins, Q1 FY2026 results [5]; FY2025 EPS $12.30, Q4/FY2025 results [6]; consensus FCF, S&P Capital IQ estimates (data/sp/estimates.json, generated 23-Jul-2026).
On consensus, the magnitude is the same order: FY2026 revenue $3,178.6M (+7.9%), normalized EPS $11.11 (−9.7% vs $12.30), and free cash flow $589.8M against FY2025's actual $622.8M — a 5.3% dip in cash, not a collapse (data/sp/estimates.json; FY2025 FCF from the cash-flow statement, fit_features.adjusted_fcf).
Source: FY2025 actual EPS $12.30 [7]; FY2026 consensus normalized EPS, S&P Capital IQ estimates (data/sp/estimates.json).
Forward estimates tell against a permanent reading in one specific place: after the trough, the FY2027 line firmed rather than fell. FY2027 normalized EPS consensus rose from $12.49 ninety days ago to $13.13 now — above FY2025's $12.30 — and FY2027 revenue eased only 1.3% over six months (from $3,531.9M to $3,486.0M) (data/sp/estimates.json, momentum block). The Street is modelling FY2026 as a trough and FY2027 as a new high, with FCF climbing $590M → $695M → $767M → $829M through FY2029.
The price change over the same window
The price moved several times the earnings line. From the 5-March peak of $135.2 the shares fell to $80.4 on 19 June — 40.6% — and sit at $95.2, 29.6% below the high; the 6-May event leg alone was −18.8% in one session on a 3.3x volume spike (fit_features.capitulation_gauge; Dislocation traces the leg by leg). At 63.3M shares, that is roughly $8.5bn of equity value at the peak, $5.1bn at the trough, and $6.0bn now — about $2.5bn erased peak-to-current, $3.5bn peak-to-trough.
Peak market cap ($bn, 5 Mar)
Current market cap ($bn, 21 Jul)
Peak → current
Peak → trough
Source: TASE daily close converted at ₪→$ 0.32641 (data/prices/daily.json, company.json.fx_rates); shares 63.3M (fit_features.market_cap.shares); drawdown depth −40.56% (fit_features.capitulation_gauge.drawdown).
The cleanest way to see what actually changed is the multiple, which is unitless. On unchanged trailing FY2025 EPS of $12.30, the price went from about $135 at the peak to $95 now — from 11.0x to 7.7x trailing earnings. On the reduced forward number ($11.08 guidance midpoint), the multiple stands at ~12.2x at the peak, ~8.6x now, and ~7.3x at the trough.
Source: price = TASE ₪ close converted at ₪→$ 0.32641 (data/prices/daily.json, company.json.fx_rates); trailing EPS $12.30 [8]; forward EPS $11.08 [9].
On unchanged trailing FY2025 earnings, the 29.6% price fall is almost entirely multiple compression — 11.0x to 7.7x is a 30% de-rating. The ~10% cut to forward earnings is a separate hit to the "E"; on that lower forward base the multiple is 8.6x, still well below the 12.2x the peak implied. Either way the market has taken roughly three turns off the multiple, and the earnings cut accounts for about a tenth of the value change.
The NPV arithmetic — temporary versus permanent
The question the price poses is whether a ~10% one-year earnings step-down is a timing trough or a permanent level shift. The two readings have very different present values. The workings below are deliberately simple and reproducible: a 9% discount rate (a profitable, net-cash software compounder; sensitivity at 8% and 10% moves the totals about ±10%), a no-shock counterfactual of FY2025 FCF ($622.8M) growing 8% — the reiterated revenue rate — and the consensus FCF path as the realised "temporary" case.
Source: consensus FCF, S&P Capital IQ estimates (data/sp/estimates.json); no-shock counterfactual = FY2025 FCF $622.8M compounded 8%; temporary shortfall = counterfactual − consensus; permanent shortfall = 10% of counterfactual (a level shift that never re-converges). Derived; discount factors at 9%.
Temporary (a V). The shortfall is concentrated in FY2026 ($82.8M) and shrinks each year as the consensus path recovers to a new high — by FY2027 consensus FCF ($695M) already exceeds FY2025 ($623M). Discounting the four shortfalls at 9% gives roughly $128M of present value, and the stream is converging to zero. Call it ~$0.13bn of NPV destroyed — about 1.6% of the ~$8.5bn pre-shock equity value.
Permanent (a level shift). If instead the ~10% reset is the new base and never closes, the shortfall grows with the business in perpetuity. The explicit four-year present value is ~$243M; adding a terminal value on a 4% perpetuity lifts the total to roughly $1.5bn. A simpler cross-check — a permanent 10% haircut to the earnings the market capitalised at the peak (~$8.5bn) — gives ~$0.8bn. The permanent reading therefore destroys on the order of $0.8–1.5bn, or 10–18% of pre-shock value.
Source: price damage from TASE drawdown (fit_features.capitulation_gauge); NPV damage from the two-scenario workings above (permanent shown at the ~14% midpoint of the 10–18% range).
The gap
Set the two side by side. The market erased 29.6% of NICE's equity value peak-to-current (40.6% peak-to-trough). The plausible value damage from the near-term hit is ~1.6% if temporary and ~10–18% if permanent. Even the permanent reading leaves a gap of roughly 12–20 percentage points against the peak-to-current move, and ~22–30 points against the trough; the temporary reading leaves a gap near 28 points. In currency, plausible NPV damage of $0.13–1.5bn sits against ~$2.5bn of market value removed peak-to-current. The gap is not a rounding artefact — it is a multiple that fell from ~11.0x to ~7.7x trailing earnings, i.e. the market repricing NICE as if the impairment were permanent and then some. Whether that is warranted is the temporary-versus-permanent question, and that verdict is not this tab's to give.
The trial — both cases, then the ruling
The temporary-versus-permanent question was argued by two opposing, corpus-cited briefs and ruled on by three independent judges.
The temporary case, at its strongest. Revenue and operating income rose every year through the "disruption": revenue $2,181M → $2,945M FY2022–FY2025, segment operating income $435M → $546M → $646M into FY2025 [10]. The growth engine is still accelerating: Q1 2026 cloud revenue $603.4M (+14.6%), AI ARR +66% to $345M and in 100% of CXone enterprise deals, with AI already ~18% of cloud backlog — demand running ahead of recognised revenue [11]. The balance sheet is net cash ($304.1M, no debt) and buybacks accelerated $145M → $489M FY2022–FY2025, cutting the share count from 66.5M to 63.3M [12]. Consensus itself models FY2026 as the trough and FY2027 as a new high.
The permanent case, at its strongest. The affected engine is the company: Customer Engagement was 83.5% of FY2025 revenue ($2,460M of $2,945M) and its growth slowed to 7.8% from 15.6% the prior year [13]. Cloud growth decelerated from ~25% (FY2024) to ~13% (FY2025) to ~12% ex-Cognigy in Q1 2026, with cloud net revenue retention only 107% and management flagging "near term pressure on NRR" as the portfolio shifts to AI [14]. The pricing unit is changing from "Human-led Seat based" per-agent licensing to "AI-led Consumption-based" [15], and the company's own filing warns AI may cut "demand for solutions priced based on the number of human agents" [16] and drive "commoditization of our products and services" [17]. Cognigy, the offsetting AI asset, cost $887.3M, accounted for by the acquisition method with the purchase price allocated to acquired assets and liabilities at fair value [18].
The ruling. The judges put the probability the impairment is temporary at 0.61 (mean 0.60, range 0.58–0.62, spread 0.04); the result is not contested. There is a mild reading-order effect — judges who read the temporary brief first landed at 0.58, those who read the permanent brief first at 0.615 — but it does not open the spread. The diagnosis therefore leans temporary while carrying real weight (~39%) on permanent.
Consensus P(temporary)
Source: trial ruling and per-judge scores (ruchir/trial/tally.json); the BigValue shows the panel p_temporary of 0.61.
This diagnosis is the report's, not a number to be rounded up: it is a lean, not a verdict, and it can flip. The judges named the conditions that would prove it permanent — ex-Cognigy cloud growth staying at or below high-single-digits with NRR falling below 107% for two consecutive quarters; the FY2026 operating margin settling at or under 25% with no H2 recovery; and FY2027 EPS/FCF failing to rebound toward FY2025 levels (ruchir/trial/tally.json, flip conditions).
Which line broke, and whether it self-corrects
The driver behind the hit is the seat-based economics of Customer Engagement cloud (data/sp/va.json isolates the cloud-revenue and margin lines; the filings name the mechanism). AI is compressing the priced unit — per-agent seats — faster than reported revenue reflects, and the transition carries higher AI-compute cost, lower-priced strategic renewals, and the Cognigy spend, which together reset the margin from ~30% toward 26% [19].
The mechanism by which it self-corrects — the temporary thesis — is refill: as seats compress, the committed AI spend is meant to replace them at higher value. The markers are consistent with refill running ahead of revenue — AI ARR +66%, 100% enterprise attach, AI ~18% of cloud backlog versus ~14% of cloud revenue, and management's expectation that this "translate[s] into improved expansion and NRR over time" [20]. The structural case against is that consumption pricing is a genuine price reset rather than a value-accretive migration — visible if ex-Cognigy cloud growth and NRR keep drifting down while AI ARR decelerates. The two are separable in the FY2026 prints, which is why the flip conditions above are the things to watch.
Figures converted from ILS at historical FX rates — see data/company.json.fx_rates. Ratios, margins, and multiples are unitless and unchanged. NICE reports its financial statements in US dollars, so the cash-flow, FCF and balance-sheet figures here are identical to the native version; only the Tel Aviv share price and market value, quoted in shekels there, are shown in dollars.
Yield
On the framework's adjusted-FCF basis — reported free cash flow less stock-based compensation less the five-year average of acquisition spend — NICE yields about 2.9% on FY2025 figures, against the roughly 8–9% bar its net-cash balance sheet selects. Reported FCF yield looks like ~10.3%; the adjustment removes ~740 bps, most of it NICE's persistent acquisition spend. The name also sits below the framework's $10B market-cap floor.
NICE reports its audited financial statements in US dollars, so every cash-flow, FCF and balance-sheet figure below is as-filed in dollars. Its shares trade in shekels on the Tel Aviv exchange; this dollar version shows the share price and market value in dollars via the NASDAQ ADR and the shekel-to-dollar rate. The financial figures match the native version of this tab because they were never in shekels.
The adjustment, line by line
NICE's structured cash-flow feed did not carry stock-based compensation or acquisition spend, and the deterministic feature file therefore reports adjusted FCF and its yield as not computable (fit_features.adjusted_fcf.latest_adjusted = null; not_computable.adjusted_fcf). The lines below are reconstructed directly from the filed consolidated statements of cash flows in the FY2021, FY2022 and FY2025 20-Fs, which is where these numbers live.
Adjusted FCF = reported FCF − stock-based compensation − trailing five-fiscal-year average of acquisition spend; figures in $M, derived from company filings. The five-year acquisition average needs a full FY2019–FY2025 window, so it is shown only for FY2023 onward. Reported FCF nets capex and capitalized internal-use software. Sources: FY2025 20-F Consolidated Statements of Cash Flows [1]; FY2022 20-F [2]; FY2021 20-F [3].
Two lines do the work. Stock-based compensation runs $146–183M a year — a genuine, recurring cost of paying employees that the cash-flow statement adds back to operating cash flow [4]. Acquisitions are the larger and lumpier item: $856.1M for Cognigy in 2025, $415.2M for LiveVox in 2023, against just $29.7M in 2022 [5]. Averaging five years is what the framework does to keep a single mega-deal from either flattering or wrecking one year's figure — and even smoothed, NICE's M&A habit costs about $302M a year against the FY2021–FY2025 window.
The result: FY2025 reported FCF of $622.8M becomes about $175M adjusted. FY2024 was the strongest recent year at $390.8M adjusted (a low acquisition year, before Cognigy loaded the average); FY2023 was $148.4M (LiveVox in the window). The three-year average of adjusted FCF is about $238M.
The yield, three ways
The denominator is NICE's market value in dollars, to match the dollar cash flow. The NASDAQ ADR closed at $101.34 on 22 July 2026, and with 63.3M shares that is a market value of about $6.4B; the Tel Aviv close of ₪291.8 on 21 July converts to about $6.0B at ₪→$ 0.326, and independent data services placed the market cap near $5.8–5.9B a few days earlier. The yield figures below use $6.0B; the conclusion holds anywhere in the $5.8–6.4B range.
Reported FCF yield (FY25)
Less SBC only
Fully adjusted (FY25)
3-yr avg adjusted
Yields = FCF measure ÷ ~$6.0B market value. Reported FCF $622.8M; less SBC $476.8M; fully adjusted $175.0M; three-year average adjusted $238.1M. FCF components from the FY2025 20-F Cash Flow Statement [6]; market value derived from the NASDAQ ADR price and company.json.fx_rates.
The reported free-cash-flow yield of ~10.3% is the number that looks attractive after a 40% share-price fall. Strip out stock compensation and it is ~7.9%; strip out the averaged acquisition spend as well and the framework yield is ~2.9%. The three-year average adjusted yield is ~3.9%. The gap between the ~10% headline and the ~3% framework figure is the whole point of this tab: reported FCF overstates what NICE returns to owners once the cost of paying staff in stock and of buying growth is charged against it.
The company's own multi-year yield baseline cannot be built from this corpus. The price history available runs only from January 2026, so there is no series of fiscal-year-end prices to compute a five-to-seven-year yield distribution or to test the "stable low yield suddenly jumps" fortress signature (fit_features.yield_baseline is empty and flagged not computable). What can be said is narrower: the reported FCF yield widened as the price fell through 2026, but on the adjusted basis the yield never approached the fortress bar.
Which bar applies — the balance-sheet class
NICE carries no financial debt after 2025. The $460M of 0% exchangeable senior notes issued in 2020 and due 2025 were repaid in full during the year [7] [8]. Against that, year-end cash of $379.4M plus short-term investments of $38.0M give $417.4M of liquidity [9].
Net cash = $417.4M liquidity − $0 debt. EBITDA = FY2025 operating income $645.8M + depreciation & amortization $199.0M = $844.8M. Net debt / EBITDA = −$417.4M ÷ $844.8M = −0.49x. Sources: FY2025 20-F Balance Sheet [10] and Income Statement [11].
Net debt / EBITDA of −0.49x is comfortably net cash, so the balance sheet is a fortress, and the reference line is the ~8–9% bar the framework applies to net-cash names (its anchor is Microsoft, whose ~4% yield stretched toward 9% on an AI scare). NICE's ~2.9% adjusted yield sits roughly 530–610 bps below that 8–9% line. Even the SBC-only-adjusted yield of 7.9% is below it; only the fully unadjusted reported FCF yield of ~10.3% would clear it, and that is not the basis the framework uses. The feature file classes the balance sheet as unknown only because its inputs were missing FY2025 debt and cash; the filed statements resolve it to fortress.
Normalization — not cyclical, but M&A-sensitive
NICE is not a cyclical business, so no mid-cycle margin normalization is warranted: revenue is 76% recurring cloud, has risen every year in the record, and reported FCF margins have held in a 18–27% band [12]. The judgment call here is not the cycle but the acquisition line. If Cognigy is treated as a one-off strategic pivot into agentic AI rather than a run-rate cost, the five-year acquisition average ex-Cognigy falls to about $131M, and FY2025 adjusted FCF rises to about $346M — a ~5.7% yield. That is the most charitable reasonable normalization, and it still sits below the 8–9% fortress bar. The band across treatments is therefore roughly 2.9% (full framework) to 5.7% (ex-Cognigy) to 7.9% (SBC only) — under the bar throughout.
The consensus check
CapIQ consensus (pulled 23 July 2026) does not publish a framework-adjusted FCF number; the closest vendor metric is consensus free cash flow (mean), which is unadjusted — it charges neither SBC nor future M&A. On that reported-FCF proxy, consensus sees free cash flow rising from $589.8M in FY2026 to $829.1M by FY2029.
Consensus free cash flow (mean); reported-basis yield on ~$6.0B market value shown for context. FY2028 and FY2029 rest on 1–2 estimates and are thin. Source: consensus estimates, CapIQ pull 23 July 2026 (data/sp/estimates.json) — no filing page.
On the reported-FCF proxy, consensus forward yields run ~9.8% (FY2026) to ~13.8% (FY2029), which clears the fortress bar. Read at face value that is the "fear, not fundamentals" setup — the sell side already expects double-digit cash yields while the buy side has marked the stock down 40%. But the comparison is not like-for-like: apply the same adjustments used on the trailing figure — subtract ~$146M of SBC and NICE's ~$130–300M of habitual M&A — and consensus adjusted FCF lands around $310–490M, a ~5–8% adjusted yield, i.e. around or just below the fortress line rather than clearly above it. The framework's forward path therefore turns on one concession: NICE would have to substantially slow acquisitions and let the five-year average roll down while consensus FCF growth arrives. For the adjusted yield to reach 8% within three years, reported FCF would need to hit roughly consensus FY2028 levels (~$767M) and annual M&A drop toward zero. Given NICE's demonstrated serial-acquirer behaviour, the probability of the framework-adjusted yield clearing the 8% bar within 1–3 years is low-to-moderate — on the order of 1-in-3 — and it requires the acquisition engine to stop, which nothing in the record suggests it will.
FCF-to-revenue trend
Conversion is stable-to-improving on a reported basis, which does not undercut the business — it is the adjustment, not the operations, that pulls the yield down.
Reported FCF and adjusted FCF each ÷ total revenue. Revenue $2,181M (FY22) → $2,945M (FY25). Derived from company filings; revenue per FY2025 20-F Income Statement [13].
Reported FCF/revenue has climbed from 18.2% in FY2022 to a 21–27% band, with FY2025's 21.1% held back by working-capital timing rather than deterioration. Adjusted FCF/revenue is lower and lumpier (5.9%–14.3%), tracking the acquisition calendar rather than any operating decline. On the framework's falsifier — is FCF/EBITDA sliding where flat was underwritten — the answer is no: the reported conversion is not deteriorating. The pressure on the yield comes from the numerator's adjustments, not from a weakening business.
Where this leaves the yield pillar
NICE's market value of ~$6.0B is below the framework's $10B universe floor, which is a threshold question the Business tab owns; it is noted here because it frames the yield work. On yield itself: the balance sheet is a genuine fortress, which sets an 8–9% bar, and the adjusted free-cash-flow yield of ~2.9% (up to ~5.7% on the most charitable M&A treatment) sits below that bar under every reasonable adjustment. The reported ~10% yield that a screen would show is an SBC-and-M&A artifact. The forward path back over the bar exists on paper through consensus FCF growth, but it depends on NICE halting the acquisitions that define its strategy — a concession the record does not support. The buyback flywheel and share-count trajectory that would compound a high yield are examined in Self-Help; the drawdown and volume capitulation behind the depressed price are in Dislocation.
Figures converted from ILS at historical FX rates — see data/company.json.fx_rates. Ratios, margins, and multiples are unitless and unchanged. NICE reports its financial statements in US dollars, so the revenue, cash-flow and FCF figures here are identical to the native version; only the Tel Aviv share price and the market value derived from it, quoted in shekels there, are expressed in dollars.
Durability
NICE clears the framework's disqualifier — revenue has risen every year for a decade, so the three-year-decline flag reads false — and its reported free cash flow has been positive and growing for seven straight years. But the year-10 gate asks for very high conviction that revenue and adjusted FCF will both be higher, and the conviction sources that would supply it — a regulatory gate, a capital-intensity moat, a duopoly structure — largely do not apply here. The one structural threat the framework tells me to hunt, AI reducing demand for per-agent software, is named by NICE itself and unresolved. There is a genuine doubt.
NICE reports its audited financials in US dollars, so every revenue, cash-flow and FCF figure on this tab is as-filed in dollars and matches the native version. Where a share price or market value appears it is shown here in dollars via the NASDAQ ADR and the shekel-to-dollar rate. Ratios and percentages are unitless throughout.
The conviction sources, one by one
Ruchir's year-10 conviction comes from five specific places. Graded honestly for NICE, one applies cleanly, two apply in part, and two do not apply at all.
Sources: founding date, FY2025 20-F Item 4.A History [1]; competitor set and leadership, FY2025 20-F Competition [2]; segment split, Note 16 [3]; capex intensity derived from reported financials.
Operating history — applies. NICE was founded on 28 September 1986, moved into the customer-service market in 1991, and has been a going concern through roughly four technology cycles, including the wrenching shift from on-premise systems to cloud that it navigated without a revenue break [4]. This is the one conviction source that clearly holds — a business that reinvented its delivery model once has shown it can adapt.
Essential product — partial. Contact-center software and the Actimize anti-money-laundering / fraud suite are genuinely mission-critical: they run high-volume, regulated workflows that customers cannot switch off, and switching vendors is disruptive. Demand held through the 2020 recession (revenue rose 4.7% that year). But the essentialness attaches to the category, not to NICE — an enterprise needs a contact-center platform, and several vendors can supply one.
Market structure — partial. NICE describes itself as a leader in Customer Engagement and competes in CCaaS against Amazon Connect, Avaya, Cisco, Five9, Genesys and TalkDesk, in conversational and agentic AI against Kore.ai, Sierra.ai, Cresta and Salesforce, and in workforce engagement against Verint, Calabrio and others [5]. Its leadership has been stable — reinforced in Business — but this is a contested oligopoly with well-capitalised entrants, not the monopoly or duopoly the framework prizes. Share here is held by out-executing, and execution is not a moat.
Regulatory entry barrier — does not apply. Nothing in law stops a rival from selling contact-center software; there is no license the regulator withholds from a garage start-up. The only place a regulatory tailwind exists is the Financial Crime & Compliance segment, where banks must run AML and fraud surveillance — but that mandate creates demand, not an entry barrier, and NICE competes there against FICO, Oracle and Nasdaq's Verafin. FCC is $485.4M of $2,945.4M in FY2025, 16.5% of revenue [6].
Capital intensity as moat — does not apply. NICE is asset-light: capital expenditure ran 3.2% of revenue in FY2025. There is no replacement-cost barrier, no physical network, no asset base a competitor must reproduce. This is precisely the profile the framework flags as unprotected in an AI world — the moat, such as it is, is scale, data and switching cost, all of which are contestable.
The structural threats, hunted
The framework's instruction is to look for the threat, quantify it, and state it plainly — and here the threat is not hypothetical. NICE's own 20-F names it.
The company writes that market acceptance of AI "may accelerate certain trends," including "a shift from seat-based recurring revenue to consumption-based revenue, or decrease in demand for solutions priced based on the number of human agents deployed" [7]. Elsewhere it describes the market it sells into as one where AI-powered automation lets businesses "handle more interactions with fewer human agents." That is the mechanism in one sentence: NICE's core Customer Engagement business — 83.5% of revenue — has historically been priced, in large part, per human agent. If generative and agentic AI reduces the number of human agents an enterprise deploys, the pricing base for the largest part of NICE shrinks unless something replaces it.
This is a textbook "your margin is my opportunity" situation. The list of firms trying to capture that pool is long and well-funded: cloud hyperscalers (Amazon Connect, and Microsoft and Google adjacent), LLM providers, and AI-native start-ups purpose-built to automate customer service — Sierra.ai, Cresta, Kore.ai — plus Salesforce, all named by NICE as competitors in the conversational and agentic AI market [8]. The 20-F's competition risk factor lists infrastructure vendors, hyperscalers, LLM providers and agentic-AI vendors as parties that "have entered or may decide in the future to enter our market space" [9].
The plausible year-10 impact is large enough to matter. The exposed base is the ~$2,460M Customer Engagement segment. NICE does not disclose the seat-priced share of it, so the precise number is unknowable from the filings — but even if only half of that revenue is tied to human-agent seat counts, a decade of AI-driven seat compression puts a low-single-digit-billion revenue pool in play. The bull rebuttal (next section) is that consumption pricing recaptures it; the point for the gate is that the outcome is a genuine contest, not a near-certainty.
The early evidence is already visible in the growth rate. Cloud revenue — 76% of the company and the entire growth engine — decelerated from +31% in 2021 to +12.8% in FY2025.
Cloud revenue: 2021 $1,018.0M, 2022 $1,295.3M, 2023 $1,581.8M, 2024 $1,984.2M, 2025 $2,238.4M. Sources: FY2021 20-F [10]; FY2023 20-F [11]; FY2025 20-F [12].
The FY2025 step-down to 12.8% has more than one cause — a large 2024 comparison and deal timing among them — but it lands exactly where the AI-durability fear predicts it would, and it is why the market took the stock down ~40% (Dislocation). The regulatory-reversal and customer-concentration threats, by contrast, are minor here: there is no single dominant regulator to reverse, and no customer concentration is disclosed. The threat that matters is substitution.
The disqualifier check — revenue trajectory
The framework's one mechanical disqualifier is revenue declining high-single-digit for three consecutive fiscal years. NICE fails to trigger it cleanly: fit_features.revenue_trajectory.consecutive_decline_years = 0 and three_year_hsd_decline = false.
Source: FY2021 20-F selected financial data [13] (2019–2021); fit_features.revenue_trajectory and FY2025 20-F Note 16 [14] (2022–2025).
Revenue rose in all seven years, including through the 2020 downturn. The honest asterisk is trajectory rather than direction: FY2024 grew 15.0% and FY2025 grew 7.7%, a deceleration, and within the mix the legacy pieces are already shrinking — services fell to 19.0% of revenue from 21.8% and product to 5.0% from 5.7% as the on-premise base rolls off [15]. So the disqualifier flag is genuinely absent (X3: checked, not present), but the trend inside a growing top line is the thing the year-10 question is really about.
FCF consistency — the P2 test
Ruchir's second durability test is that the rolling five-year average of adjusted FCF be stable and predictable, with occasional negative years acceptable only where they are business-model-inherent (an insurer's or bank's underwriting cycle). The deterministic file cannot compute the rolling average — fit_features.fcf_stability is empty because there are fewer than five consecutive adjusted-FCF years (not_computable.fcf_stability). Reconstructed from the filed cash-flow statements, the underlying record is nonetheless clear.
Reported FCF = operating cash flow − capital expenditure, from the consolidated statements of cash flows; FY2025 figure per the FY2025 20-F cash-flow statement [16]; earlier years from FY2021 and FY2022 20-Fs, consistent with fit_features.adjusted_fcf.series.
Reported FCF has been positive and broadly rising for seven consecutive years, with no negative episodes — a clean pass on the spirit of P2. The unpredictability, such as it is, lives one layer down, in adjusted FCF (reported FCF less stock-based compensation less the trailing five-year average of acquisitions), which the Yield tab reconstructs at roughly $148M in 2023, $391M in 2024 and $175M in 2025. That series is lumpy — but the lumpiness is acquisition timing, not an underwriting cycle: NICE spent about $856M on acquisitions in 2025 (Cognigy and others), which pulls the five-year average up and the adjusted figure down. This is a software compounder, so the "healthy negative year every five to eight years" mechanism the framework welcomes for insurers simply does not apply. The P2 caution is different and specific: if defending the moat against AI requires continuous acquisition of AI capability, that acquisition drag on adjusted FCF is structural, not a one-off.
The year-10 case, both ways
The strongest case that year-10 revenue and adjusted FCF are higher. NICE has grown revenue every year for a decade and generated positive, rising FCF for seven, through a recession and a full delivery-model transition. Cloud is 76% of the business and, even after decelerating, still compounds double digits. The category is essential and switching costs are real. Management is not standing still: it puts the AI opportunity at a total addressable market expanding from $31B in 2025 to $72B by 2028 [17], targets more than $1B of AI revenue by 2028 [18], and is re-architecting pricing toward a "mix of seat, consumption and outcome-based" contracts [19] that "scale with AI interaction volume and platform utilization" [20]. If that pivot works, AI is a tailwind — NICE monetises the interaction whether a human or a bot handles it, and the seat-erosion risk inverts into a volume story.
The strongest doubt. That case rests on an unproven business-model transition, executed against better-capitalised opponents, in a market with no regulatory gate and no capital-intensity moat to slow them. The conviction sources that would make year-10 higher revenue near-certain — a monopoly/duopoly, a regulator's barrier, an irreplaceable asset base — are the two that do not apply and the one that only half-applies. Meanwhile the company itself flags that AI may cut demand for its per-agent pricing, the growth engine has decelerated to 12.8%, and the firms aiming at its margin pool include Amazon, Microsoft, Google, Salesforce and a cohort of well-funded AI-natives. The consumption pivot may well succeed — but "may well succeed" is not the very high conviction the gate demands.
My read, stated once: there is a genuine doubt, so the year-10 gate does not hold. This is not a verdict that NICE is a poor business — the disqualifier is absent, FCF consistency passes, and the operating history is real. It is that the gate is binary by construction, it requires near-certainty, and near-certainty is unavailable when a company's largest revenue base faces a substitution threat it names itself and defends with an unproven pricing transition rather than a structural barrier. What would change the read: two or three years of evidence that consumption and AI revenue is growing faster than seat revenue erodes — i.e., cloud growth re-accelerating while net revenue retention holds — would convert the doubt into conviction and let the gate close.
Figures converted from ILS at historical FX rates — see data/company.json.fx_rates. Ratios, margins, and multiples are unitless and unchanged. NICE reports its financial statements in US dollars; only the Tel Aviv share price and the market value derived from it are converted here.
Self-Help
NICE enters the dislocation debt-free: the $460 million 0% notes were repaid at maturity in September 2025, leaving only $88.8 million of operating leases against $417 million of cash plus an undrawn $300 million revolver [1][2]. The buyback engine is real and accelerating — $145M to $489M across 2022–2025, a record $253 million in Q1 2026, over half of free cash flow committed [3][4]. Share count is falling; stock-based compensation and acquisitions make adjusted capacity thinner than headline FCF suggests.
The balance sheet against the problem's duration
The framework's question here is whether the company can outlast a multi-year problem without capital allocation being forced toward debt paydown at the moment repurchases matter most. For NICE the answer is unambiguous, because the debt is already gone.
Cash + ST Investments ($M)
Financial Debt ($M)
Undrawn Revolver ($M)
FY2025 Free Cash Flow ($M)
Source: FY2025 Annual Report (Form 20-F), Consolidated Balance Sheets [5], Statements of Cash Flows [6], and the Credit Agreement disclosure [7].
The one piece of financial debt NICE carried into this period was $460 million of 0% exchangeable senior notes due 2025. They bore no interest and did not accrete; they fully matured on September 15, 2025 and were settled in cash for $460 million, with no conversion value above principal [8]. On the balance sheet the effect is stark: the "Debt" line reads zero at December 31, 2025, against $458.8 million a year earlier [9].
A genuine year-by-year maturity schedule is therefore short:
| Maturity | Financial debt | Detail |
|---|---|---|
| 2025 | $460M | 0% exchangeable notes — settled in cash at maturity, Sept 15, 2025 |
| 2026 and after | $0 | No financial debt outstanding |
| Operating leases | $88.8M total | $13.7M current, $75.1M long-term; 7.6-yr weighted term at 4.78% |
Source: FY2025 Annual Report (Form 20-F), debt and lease footnotes [10][11][12].
There is no covenant that binds, because there is nothing drawn to covenant against: on February 20, 2026 NICE closed a new senior secured revolving facility of $300 million with JPMorgan, guaranteed by its U.S. subsidiaries — additional headroom, undrawn [13]. Refinancing risk at current rates does not apply when there is nothing to refinance.
The one qualification is that the liquid cushion is thinner than the headline zero-debt read implies. NICE ran its cash and short-term investments down from $1.62 billion at the end of 2024 to $417 million at the end of 2025, spending the difference on the $460 million note repayment, the Cognigy acquisition, and buybacks [14][15]. Even so, zero debt, a $300 million undrawn revolver, and more than $600 million of annual free cash flow mean allocation is not forced toward the balance sheet. NICE can comfortably outlast a multi-year problem with repurchases still on the table.
The repurchase record — executed, not authorized
This is not an authorization sitting unused. Cash actually spent on buybacks has risen every year, and the programs have been executed to completion, not announced and left idle.
Source: FY2025 Annual Report (Form 20-F), Consolidated Statements of Cash Flows, "Purchase of treasury shares" [16].
The $500 million program authorized in June 2024 was fully executed by December 31, 2025; the Board then authorized a further $500 million in May 2025 and another $600 million in February 2026 [17]. In 2025 NICE bought back 3,636,837 ADRs at an average price of $134.43, working down from $170 in January to $108.63 in December as the shares fell [18]. That average sits roughly 41% above today's ADR near $95 — so the bulk of the recent repurchases were done richer than the current quote, and the accelerating pace into the drawdown is now buying stock materially cheaper.
The share count is falling, which clears the framework's hard-fail bar — a rising count driven by SBC or serial issuance is not present here.
| Fiscal year-end | Buyback cash | Avg price paid | Shares (feature basis) | Shares outstanding (20-F) |
|---|---|---|---|---|
| 2022 | $144.9M | — | 66.5M | — |
| 2023 | $288.4M | — | 66.3M | — |
| 2024 | $369.2M | — | 65.5M | 63.2M |
| 2025 | $488.9M | $134.43 | 63.3M | 60.4M |
| Q1 2026 | $253M (record) | — | — | ~58.5M |
Sources: share-count trajectory from fit_features.share_count_trend; period-end outstanding and average price from the FY2025 Annual Report (Form 20-F) [19][20]; Q1 2026 figures from the Q1 2026 earnings call [21].
Two caveats keep this honest. First, the net reduction has been modest: on the feature basis the count fell from 66.5 million to 63.3 million over three years, about 1.6% a year, because stock-based compensation of $146–182 million annually replaces roughly half of what the buybacks retire [22], and the 2025 Cognigy deal added ADSs for part of the consideration (management calls the dilution immaterial). Second, the two share series differ: the deterministic feature uses 63.3 million for FY2025, while the 20-F reports 60.4 million ordinary shares actually outstanding at year-end and management cited approximately 58.5 million by the end of March 2026 after the record quarter [23][24]. The Q1 2026 pace — a 5% year-over-year decline in shares, and repurchases equal to 3.5% of market value in a single quarter — is far quicker than the multi-year average, helped by the lower price.
Management's buyback intent, from the record
The buyback question is asked on every call, and management's answer has hardened as the balance sheet cleared. On the Q1 2026 call the CFO stated NICE "remain[s] committed to our share repurchases exceeding 50% of our free cash flow this year," having just executed "a record $253 million of shares representing 3.5% of our market capitalization," and exited the quarter with $745 million of buyback still authorized [25]. On the Q4 2025 call management framed the setup as "a strong balance sheet that supports investment and continued capital returns to our shareholders" [26]. Capital return has been a persisted theme across the call history — buybacks scaled steadily while the debt was retired — rather than a new talking point.
At the current roughly 10% free-cash-flow yield (see Yield), a commitment to return more than half of free cash flow translates to a buyback of roughly 5% of market value a year at these prices — before any operating growth. That is the flywheel the dislocation is meant to supply; NICE has both the capacity and the stated intent to run it.
The levered exception does not apply
The framework's levered-path exception is reserved for cases where the adjusted yield is very high — on the order of 25% or more — and demands three legs together: a massive yield, a demonstrated multi-year share-count reduction, and FCF/revenue that is not deteriorating. NICE's free-cash-flow yield is near 10%, not 25%-plus, so the exception is not in play and the ordinary fortress-or-moderate reading governs. NICE clears that ordinary reading on the balance-sheet leg; the yield magnitude is the Yield tab's to weigh.
The absurdity check
The deterministic float_retirement_years feature is not_computable because the reporting currency (USD) and the price currency (ILS) do not match and the FX conversion was not attempted in the feature build. Converting the market value to dollars closes that gap. At about $95 per ADR on roughly 63.3 million shares, NICE is worth about $6.0 billion. Against FY2025 free cash flow of $622.8 million, that is:
$6.0 billion ÷ $622.8 million ≈ 9.7 years of free cash flow to retire the entire float.
On management's more recent share count near 58.5 million, the market value is closer to $5.6 billion and the figure drops to roughly 9 years.
The number does more work once adjusted. Netting only stock-based compensation ($146.0 million) lifts the payback to about 12.6 years [27]. NICE's acquisition habit stretches it further: cash paid for businesses was $415 million in 2023, $65 million in 2024, and $856 million in 2025 (Cognigy), averaging roughly $445 million a year over that window [28]. The framework's adjusted FCF nets a multi-year average of that spend, which compresses the figure toward break-even in a heavy acquisition year. Because the Cognigy purchase is lumpy and no clean five-year window exists, adjusted FCF is itself not_computable; the raw ~10-year payback is the reliable anchor, and the acquisition drag is the swing factor the Yield tab carries.
Dividend safety
NICE pays no ordinary dividend and states it has "no plans at this time to make any future dividend payments" [29]. The dividend yield is zero and forms no part of the return case, which rests entirely on the buyback flywheel above; dividend cover is therefore not applicable.
Management credibility
The promise-versus-delivery record is mixed but not promotional. Management tends to hit the conservative guides it sets at the start of a year and to overreach on the mid-year raises.
| Promise (call) | What was said | Outcome |
|---|---|---|
| FY2024 cloud growth (Q2 2024) | ~18% organic cloud, ex-LiveVox | Missed — cut to 16%–17% one quarter later |
| FY2025 cloud growth (Q4 2024) | +12% | Kept — finished about 13% |
| FY2025 EPS (Q4 2024) | $12.13–$12.33 | Kept — landed at $12.30 |
| FY2025 EPS raise (Q2 2025) | raised to $12.33–$12.53 | Missed — trimmed for Cognigy dilution; $12.30, below the raised floor |
| FY2026 cloud growth (Q4 2025) | 14.5%–15% | Walked back to 13%–15% one quarter later |
Sources: NICE quarterly earnings calls, Q2 2024 [30], Q3 2024 [31], Q4 2024 [32], Q2 2025 [33], Q4 2025 [34], Q1 2026 [35]; FY2025 EPS outcome from the Q4 2025 call [36].
Two of the five promises were missed, but each miss has a benign cause on the record — elongated enterprise deployment ramps in 2024, and Cognigy acquisition dilution against the 2025 raise — rather than an operational shortfall dressed up. The one language flag worth stating plainly: on the Q1 2026 call, management reframed a discount-driven cut to its own cloud guidance as "playing offense," insisting the marquee-customer repricing was proactive rather than a concession to buyer pressure [37]. That is a promotional tell to note, not a pattern; the earlier Russell-led calls leaned on "prudent guidance" hedging instead [38].
On alignment, insider economic ownership is low. Directors and executive officers together beneficially owned 407,795 shares — about 0.7% of the company — at February 18, 2026, with no individual owning 1% or more, and vested option and RSU exercise prices averaging $86.15 [39]. There is no controlling shareholder; the two holders above 5% are passive institutions (Principal at 7.9%, Harel at 5.3%) [40]. Governance is clean — eight independent directors, chairman and CEO roles held by different people — but the thin insider stake means management's economic skin is in compensation, weighted to equity, rather than in a founder-sized holding. Taken together: a credible, non-promotional record with a noted habit of over-optimistic mid-year raises and low insider ownership — not a framework exclusion.
Figures converted from Israeli shekels (₪) at historical FX rates — see data/company.json.fx_rates. NICE reports its financial results in US dollars, so revenue, EPS, and free cash flow are unchanged; only the shekel share-price levels and shekel-converted analyst targets are shown in dollars (share levels at ₪→$ 0.32641, applied uniformly so the −40.6% drawdown is preserved). Ratios, margins, and multiples are unitless and unchanged.
Clock — the mechanism, the timing, the instruments
The nearest dated catalyst is the Q2 2026 report on 5 August 2026, which tests a deliberately soft 5.5% revenue guide; consensus models the growth trough at that print and a reacceleration through FY2027. The two prior guide-driven drawdowns round-tripped inside four months, but this one is roughly double their depth. The sell side has not capitulated — zero sell ratings, price targets averaging ~35% above spot. Listed NASDAQ options run out to a January 2028 LEAP; near-term implied volatility sits at ~58–62%, elevated.
NICE reports results in US dollars but its shares trade in shekels on the Tel Aviv Stock Exchange, with a NASDAQ ADR twin (one ADR per ordinary share). Below, price levels, market value, and analyst targets are shown in $ (shekel closes converted at ₪→$ 0.32641; ADR targets are natively in dollars); revenue, EPS, and free cash flow are in $ as the company reports them. The companion page shows the native shekel levels.
The re-rating mechanism — five dated levers, one imminent
What would close the gap is not "sentiment." It is a specific set of printed events, each with a calendar. The dislocation itself — a 40.6% peak-to-trough fall whose defining leg was the 18.8% single-session drop on the 6-May Q1 report — is anatomized in the Dislocation tab; this tab is about what reverses it and when.
1. The Q2 2026 print against a low bar — 5 August 2026 (imminent). Management guided Q2 non-GAAP revenue to $761–771 million, "representing 5.5% year over year growth at the midpoint" [1] — a deliberate step down from the 9.8% just reported, set low after pricing concessions pulled revenue into a Q2 "phasing" hole. Consensus has settled at $766.4 million and $2.64 of EPS for the quarter (CapIQ / yfinance, 15–16 analysts). The mechanism here is guidance resetting against a bar the company itself lowered: a Q2 that meets or clears the soft guide, with cloud net-revenue-retention no longer sliding, removes the specific fear that repriced the stock. It is the single most concrete near-term event, roughly two weeks out.
2. Cloud-growth reacceleration showing up in the printed line — H2 2026 into 2027. Consensus does not expect the deceleration to continue: revenue-growth troughs at the Q2 +5.5% and reaccelerates to +8.7% at Q3 (reported ~November 2026) and +9.7% for FY2027. The engine is AI ARR, which grew 66% year over year to $345 million but is still only ~14% of cloud — not yet large enough to offset the seat compression showing in retention. The catalyst is the crossover printing: cloud net revenue retention, reported at 107% and falling, stabilizing or turning up [2]. Window: two to four quarters of prints.
3. EPS growth returning against an easy compare — FY2027. FY2026 is an earnings-down year — consensus EPS of $11.09 is 9.8% below FY2025's ~$12.30 as the AI transition absorbs investment. Consensus then has FY2027 EPS at $12.63, up 13.9% and back above the 2025 level. The YoY compares turn favourable from the Q1 2027 print (~May 2027); that is when the growth-stock screen sees a re-accelerating earnings line again.
4. The buyback shrinking the denominator — continuous. NICE repurchased a record $253 million of stock in Q1 2026, about 3.5% of its market capitalization, exited the quarter with $745 million of authorization remaining, and is "committed to our share repurchases exceeding 50% of our free cash flow this year," cutting shares ~5% year over year [3]. This is mechanical and does not wait for a catalyst; its pace and coverage are quantified in Self-Help.
5. The Actimize divestiture — a live process, no fixed close. NICE put its Actimize financial-crime unit up for sale at a $1.5–2 billion tag in November 2025; by early May 2026 "five bidders advance in Nice's $2.5 billion Actimize sale process," with the floor reported near ~$2.5 billion [4]. A completed sale would crystallize a sum-of-parts discount and hand more capital to the buyback. The caveat is real: the corpus documents an active auction and non-binding bids, not a signed deal or a closing date, so this lever carries execution and timing risk the others do not.
Sources: Q2 and full-year guidance, Q1 2026 press release [5]; Q1 2026 call [6]; Actimize process, news digest [7]; consensus horizons from CapIQ / yfinance estimates (data/estimates/analyst_estimates.json).
Base rates — NICE's own history of guide-driven drawdowns
The framework asks for prior drawdown episodes of comparable depth from this name's own history — how deep, how long to trough, how long to round-trip. A limitation binds first: the run's price feed is a six-month, web-sourced daily history (23 January – 21 July 2026), so a multi-year, price-measured base-rate table cannot be built from the run's own price data. What the corpus does give is a repeated, dated pattern: a beat overwhelmed by a soft cloud/margin guide, sold off hard in a single session.
- February 2025. NICE "beats Q4 estimates but shares plunge on weak 2025 outlook" — a cautious FY2025 guide after 25% FY2024 cloud growth [8]. Depth not quantified in the corpus.
- November 2025. "Nice shares plummet as AI growth can't offset weak guidance" — a roughly 20% single-quarter plunge on the soft 2026 profitability outlook, contemporaneously framed as "NICE's 20% Plunge: A Catalyst-Driven Mispricing or Justified Discount?" [9].
- May 2026. The current episode: an 18.8% single-session drop, 40.6% peak-to-trough — the deepest of the three, and roughly double the November precedent.
The round-trip base rate is where the price feed helps. NICE traded at $114.0 on 23 January 2026 and made a marginal high of $135.2 on 5 March 2026 — meaning the ~20% November 2025 plunge had fully round-tripped and printed a higher high in roughly four months. The February 2025 drawdown had likewise been recovered by then. On the two occasions the run's evidence can bracket, a guide-driven drawdown was recovered inside a year, and the shallower November episode inside a single quarter. The current episode is deeper than either, so applying their four-month round-trip to a 40.6% fall is not warranted — the base rate says these drawdowns have reversed, not that they reverse this fast at twice the depth.
Sources: prior-episode magnitudes and framing from the news digest [10]; $114.0, $135.2, $80.4, $95.2 levels and the −40.6% depth from the run's daily price feed (data/prices/daily.json) and fit_features.capitulation_gauge.drawdown.
The current episode's recovery-so-far is visible in the feed: from the $80.4 trough on 19 June, the stock is back to $95.2 — up 18.5% off the low in about five weeks, still 29.6% below the March peak.
Source: daily close, TASE, converted to $ (data/prices/daily.json); trough $80.4 (19 Jun 2026) and current $95.2 (21 Jul 2026) per fit_features.capitulation_gauge.drawdown.
The 18-month test
Given the mechanism and the base rates, re-recognition within ~18–24 months is a reasonable expectation, contingent on one thing: the cloud-growth and net-revenue-retention line stabilizing in printed quarters. Three facts support it — consensus itself models the growth trough at the imminent Q2 print with reacceleration through FY2027; the two prior guide-driven drawdowns round-tripped within four to twelve months; and the buyback shrinks the denominator every quarter without waiting for a catalyst. The path does not obviously require years of cycle repair. What would falsify that read is concrete and belongs to the Damage Math tab's ledger: if agentic AI is structurally displacing the human seats NICE bills against, cloud growth keeps decelerating below the guided 13%–15% and NRR keeps falling, no printed quarter reaccelerates, and the 18-month window becomes a multi-year AI-transition repair instead.
What consensus expects, and when
Two readings matter here: where the sell side is positioned, and when it expects the recovery to print.
The sell side has not capitulated. Of 16 covering analysts, the current split is 2 strong-buy, 7 buy, 7 hold, and 0 sell; three months ago it was 4 strong-buy, 5 buy, 7 hold, 0 sell — the top of the rating stack softened, but no analyst has moved to sell through the entire 40.6% drawdown. The price-target range tells the same story: on the NASDAQ ADR the mean target is ~$128 and the low target is $100, both above the ~$95 ADR spot — the entire published target range sits at or above the current price.
Source: analyst price targets and recommendation counts, CapIQ / yfinance as of 23 Jul 2026 (data/estimates/analyst_estimates.json); spot is the ₪291.8 close converted at 0.32641 (data/company.json.fx_rates, 2026-07-23).
The recovery is expected to print, but not immediately. Consensus has revenue growth troughing at the Q2 +5.5% and reaccelerating from Q3; EPS, by contrast, is down ~12% year over year in both Q2 and Q3 2026 and does not turn positive until FY2027 (+13.9%). A re-rating usually needs a printed quarter, and the candidate is not the very next one: the earliest quarter consensus itself models a re-accelerating earnings line is Q1 FY2027 (~May 2027), while the revenue line reaccelerates a step earlier at Q3 2026 (~November 2026). Estimate revisions are not cutting into that: FY2026 EPS has been revised up by 16 of 16 analysts over the last 30 days and nudged from $10.95 to $11.09 over 90 days.
Source: consensus revenue and EPS estimates, CapIQ / yfinance, 15–16 analysts (data/estimates/analyst_estimates.json, earnings_estimate & revenue_estimate).
The free-cash-flow path consensus models runs the same shape: a dip to $589.8 million in FY2026 from FY2025's $648.6 million, then reacceleration to $694.8 million (FY2027), $767.4 million (FY2028), and $829.1 million (FY2029) (CapIQ consensus; the yield this implies is in the Yield tab).
Instrument facts
These are stated as facts, not suggestions. NICE's NASDAQ ADRs (traded in US dollars, one ADR per ordinary share) carry listed options with long-dated expiries. As of 22 July 2026, the available expirations run 21 August 2026, 18 September 2026, 20 November 2026, 15 January 2027, 19 February 2027, and a 21 January 2028 LEAP — so contracts more than 12 months out (indeed ~18 months) exist. Open interest is present but modest against a mega-cap: near-the-money contracts show open interest in the hundreds to low thousands (for example a near-money put with roughly 2,053 contracts open).
The current implied-volatility level, from a dated source, is elevated. On 22 July 2026 near-the-money August-2026 contracts carried implied volatility of roughly 58%–62% (a ~$90 call near 62%, a ~$95 put near 58%) — into the "elevated" band by the framework's reference lines (up to ~50–55 acceptable, 60–70 elevated). That August contract spans the 5 August earnings date, so it embeds event premium. For context, the same instrument showed implied volatility near 45% in mid-April 2026, before the dislocation — the vol premium has risen with the drawdown. These readings are from a delayed public options feed (Investing.com), dated and citable but not real-time exchange data; strikes and expiries are reported here as facts about the instrument, not as anything to act on.
Because long-dated options do exist on this name, the framework's watchlist-routing consequence — the rule that sends names lacking long-dated instruments off the book — does not bind here as a matter of instrument availability.